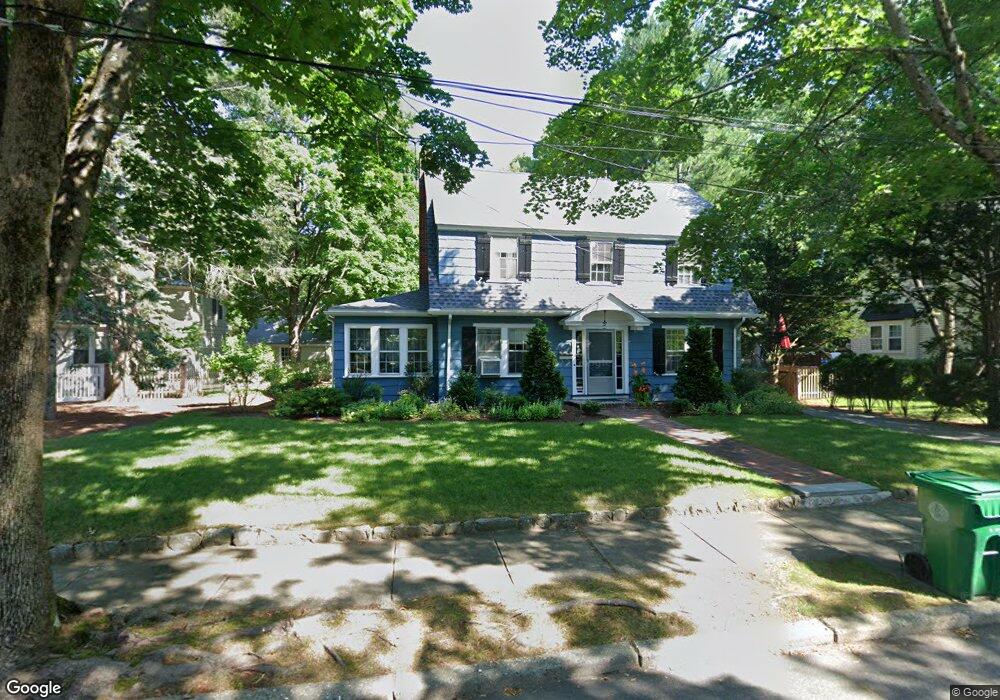
27 Randolph St Newton Highlands, MA 02461
Waban NeighborhoodEstimated Value: $1,718,000 - $1,828,000
3
Beds
2
Baths
2,263
Sq Ft
$782/Sq Ft
Est. Value
About This Home
This home is located at 27 Randolph St, Newton Highlands, MA 02461 and is currently estimated at $1,769,694, approximately $782 per square foot. 27 Randolph St is a home located in Middlesex County with nearby schools including Zervas Elementary School, Oak Hill Middle School, and Newton South High School.
Ownership History
Date
Name
Owned For
Owner Type
Purchase Details
Closed on
Aug 31, 2022
Sold by
Cooper Nancy
Bought by
Nancy L Cooper Ret
Current Estimated Value
Purchase Details
Closed on
Jan 14, 1994
Sold by
Mcdonald Kevin R and Mcdonald Diana K
Bought by
Bulka Zeev and Bulka Nancy C
Home Financials for this Owner
Home Financials are based on the most recent Mortgage that was taken out on this home.
Original Mortgage
$279,400
Interest Rate
7.22%
Mortgage Type
Purchase Money Mortgage
Purchase Details
Closed on
Jun 30, 1988
Sold by
Asch Donald R
Bought by
Mcdonald Kevin A
Home Financials for this Owner
Home Financials are based on the most recent Mortgage that was taken out on this home.
Original Mortgage
$256,000
Interest Rate
10.47%
Mortgage Type
Purchase Money Mortgage
Create a Home Valuation Report for This Property
The Home Valuation Report is an in-depth analysis detailing your home's value as well as a comparison with similar homes in the area
Home Values in the Area
Average Home Value in this Area
Purchase History
| Date | Buyer | Sale Price | Title Company |
|---|---|---|---|
| Nancy L Cooper Ret | -- | None Available | |
| Bulka Zeev | $349,250 | -- | |
| Mcdonald Kevin A | $320,000 | -- |
Source: Public Records
Mortgage History
| Date | Status | Borrower | Loan Amount |
|---|---|---|---|
| Previous Owner | Mcdonald Kevin A | $340,000 | |
| Previous Owner | Mcdonald Kevin A | $279,400 | |
| Previous Owner | Mcdonald Kevin A | $256,000 |
Source: Public Records
Tax History Compared to Growth
Tax History
| Year | Tax Paid | Tax Assessment Tax Assessment Total Assessment is a certain percentage of the fair market value that is determined by local assessors to be the total taxable value of land and additions on the property. | Land | Improvement |
|---|---|---|---|---|
| 2025 | $13,614 | $1,389,200 | $974,600 | $414,600 |
| 2024 | $13,163 | $1,348,700 | $946,200 | $402,500 |
| 2023 | $12,370 | $1,215,100 | $722,300 | $492,800 |
| 2022 | $11,836 | $1,125,100 | $668,800 | $456,300 |
| 2021 | $11,421 | $1,061,400 | $630,900 | $430,500 |
| 2020 | $11,081 | $1,061,400 | $630,900 | $430,500 |
| 2019 | $10,769 | $1,030,500 | $612,500 | $418,000 |
| 2018 | $10,258 | $948,100 | $554,400 | $393,700 |
| 2017 | $9,946 | $894,400 | $523,000 | $371,400 |
| 2016 | $9,513 | $835,900 | $488,800 | $347,100 |
| 2015 | $9,070 | $781,200 | $456,800 | $324,400 |
Source: Public Records
Map
Nearby Homes
- 35 Bradford Rd
- 200 Lincoln St
- 1077 Boylston St
- 17 Circuit Ave Unit 2
- 120 Stanley Rd
- 3 Glenmore Terrace Unit 2
- 35 Kingston Rd
- 131 Oliver Rd
- 103 Thurston Rd
- 102 Thurston Rd Unit 100
- 66 Rockland Place
- 2 Raeburn Terrace
- 873 Chestnut St
- 1151 Walnut St Unit 205
- 1151 Walnut St Unit 405
- 1151 Walnut St Unit 207
- 51 Pettee St Unit 11
- 992 Chestnut St
- 80 Pine Ridge Rd
- 989 Chestnut St Unit 8
- 21 Randolph St
- 141 Dickerman Rd
- 127 Dickerman Rd
- 123 Dickerman Rd
- 20 Randolph St
- 136 Dickerman Rd
- 140 Dickerman Rd
- 110 Woodward St
- 128 Woodward St
- 130 Dickerman Rd
- 144 Dickerman Rd
- 119 Dickerman Rd
- 157 Dickerman Rd
- 124 Dickerman Rd
- 136 Woodward St
- 115 Dickerman Rd
- 148 Dickerman Rd
- 12 Randolph St
- 161 Dickerman Rd
- 29 Harrison St