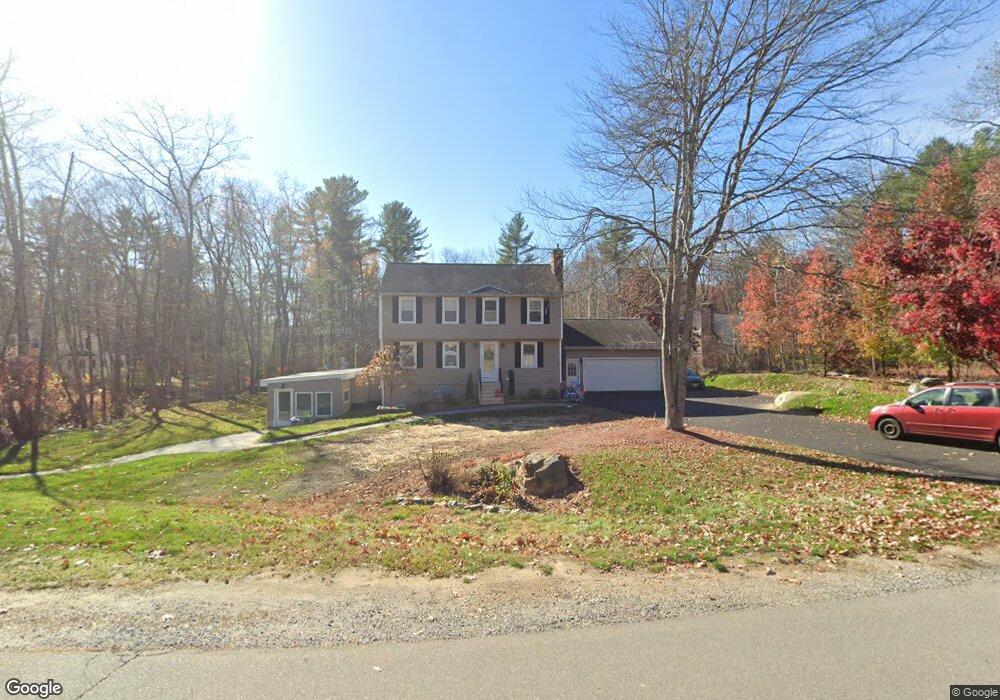
27 Red Deer Rd Londonderry, NH 03053
Estimated Value: $588,000 - $643,607
5
Beds
5
Baths
2,084
Sq Ft
$296/Sq Ft
Est. Value
About This Home
This home is located at 27 Red Deer Rd, Londonderry, NH 03053 and is currently estimated at $615,902, approximately $295 per square foot. 27 Red Deer Rd is a home with nearby schools including Matthew Thornton Elementary School, Londonderry Middle School, and Londonderry Senior High School.
Ownership History
Date
Name
Owned For
Owner Type
Purchase Details
Closed on
Nov 25, 2020
Sold by
William T Mahan Ret
Bought by
Larson Aubrey R and Dike Alfred U
Current Estimated Value
Home Financials for this Owner
Home Financials are based on the most recent Mortgage that was taken out on this home.
Original Mortgage
$298,400
Interest Rate
2.7%
Mortgage Type
Purchase Money Mortgage
Purchase Details
Closed on
Dec 13, 2017
Sold by
Mahan William T and Mahan Donna L
Bought by
William T Mahan Jr Ret
Purchase Details
Closed on
Jan 22, 1996
Sold by
Metko James C and Metko Kathi M
Bought by
Mahan William T and Mahan Donna L
Home Financials for this Owner
Home Financials are based on the most recent Mortgage that was taken out on this home.
Original Mortgage
$87,000
Interest Rate
7.16%
Create a Home Valuation Report for This Property
The Home Valuation Report is an in-depth analysis detailing your home's value as well as a comparison with similar homes in the area
Home Values in the Area
Average Home Value in this Area
Purchase History
| Date | Buyer | Sale Price | Title Company |
|---|---|---|---|
| Larson Aubrey R | $373,000 | None Available | |
| William T Mahan Jr Ret | -- | -- | |
| Mahan William T | $137,000 | -- |
Source: Public Records
Mortgage History
| Date | Status | Borrower | Loan Amount |
|---|---|---|---|
| Previous Owner | Larson Aubrey R | $298,400 | |
| Previous Owner | Mahan Donna L | $60,000 | |
| Previous Owner | Mahan William T | $87,000 |
Source: Public Records
Tax History Compared to Growth
Tax History
| Year | Tax Paid | Tax Assessment Tax Assessment Total Assessment is a certain percentage of the fair market value that is determined by local assessors to be the total taxable value of land and additions on the property. | Land | Improvement |
|---|---|---|---|---|
| 2024 | $9,761 | $604,800 | $220,300 | $384,500 |
| 2023 | $9,465 | $604,800 | $220,300 | $384,500 |
| 2022 | $8,529 | $461,500 | $165,100 | $296,400 |
| 2021 | $7,628 | $415,000 | $165,100 | $249,900 |
| 2020 | $7,413 | $368,600 | $127,100 | $241,500 |
| 2019 | $7,147 | $368,600 | $127,100 | $241,500 |
| 2018 | $6,789 | $311,400 | $104,800 | $206,600 |
| 2017 | $6,729 | $311,400 | $104,800 | $206,600 |
| 2016 | $6,695 | $311,400 | $104,800 | $206,600 |
| 2015 | $6,546 | $311,400 | $104,800 | $206,600 |
| 2014 | $6,567 | $311,400 | $104,800 | $206,600 |
| 2011 | -- | $300,300 | $104,800 | $195,500 |
Source: Public Records
Map
Nearby Homes
- 35 Red Deer Rd
- 224 High Range Rd
- 193 Fieldstone Dr
- 193 Fieldstone Dr Unit 193
- 169 Fieldstone Dr
- 5 Hickory Hill Dr
- 118 Fieldstone Dr Unit 118
- 11 Elise Ave Unit Lot 91
- 15 Harvey Rd
- 27 Buckingham Dr
- 57 Hardy Rd
- 17 Welch Rd
- 3 Chandler Dr
- 38 Bartley Hill Rd
- 8 Iroquois Cir
- 10 Judy Dr
- 20 Wedgewood Dr
- 50 Bartley Hill Rd
- 32 Noyes Rd
- 28 Barksdale Ave