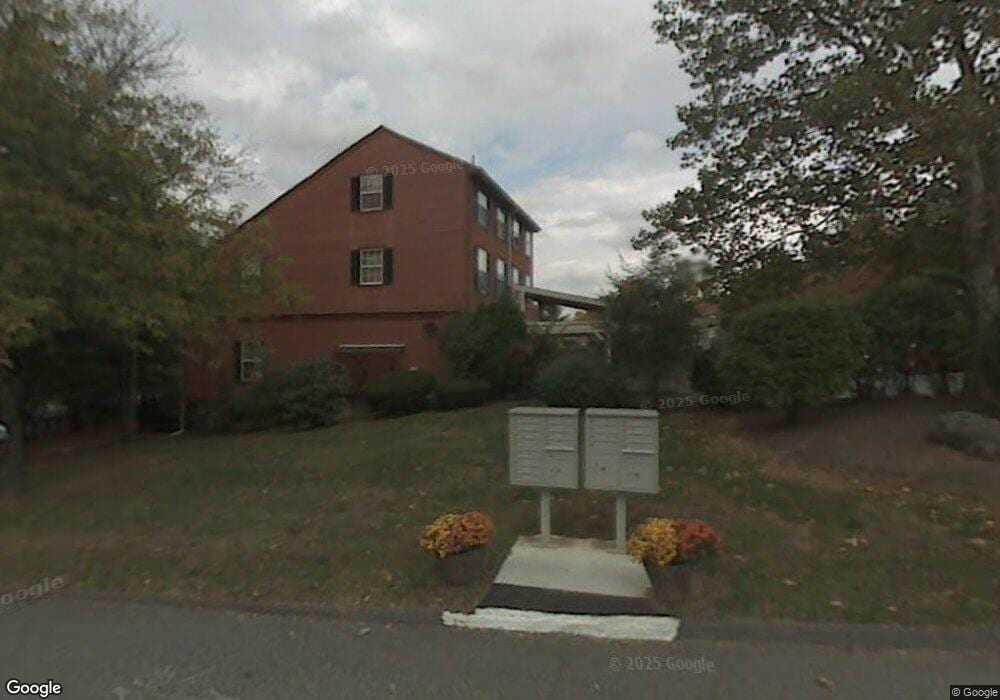
27 Rising Trail Ct Middletown, CT 06457
Westfield NeighborhoodEstimated Value: $211,000 - $231,000
2
Beds
2
Baths
1,120
Sq Ft
$196/Sq Ft
Est. Value
About This Home
This home is located at 27 Rising Trail Ct, Middletown, CT 06457 and is currently estimated at $220,031, approximately $196 per square foot. 27 Rising Trail Ct is a home located in Middlesex County.
Ownership History
Date
Name
Owned For
Owner Type
Purchase Details
Closed on
Jun 6, 2019
Sold by
Marion Sulvatore N
Bought by
Kishore Stephanie A
Current Estimated Value
Home Financials for this Owner
Home Financials are based on the most recent Mortgage that was taken out on this home.
Original Mortgage
$124,160
Outstanding Balance
$109,162
Interest Rate
4.2%
Mortgage Type
Purchase Money Mortgage
Estimated Equity
$110,869
Purchase Details
Closed on
Jul 18, 2016
Sold by
Fhlmc
Bought by
Marino Salvatore N
Purchase Details
Closed on
Mar 31, 2015
Sold by
Bank Of America Na
Bought by
Fhlmc
Purchase Details
Closed on
Aug 9, 2004
Sold by
Wintenburg 3Rd Keith V and Wintenberg Anne Marie B
Bought by
Nottingham David M
Purchase Details
Closed on
Aug 14, 1996
Sold by
Segar Debra D
Bought by
Dubois Kathleen M
Home Financials for this Owner
Home Financials are based on the most recent Mortgage that was taken out on this home.
Original Mortgage
$48,450
Interest Rate
8.08%
Mortgage Type
Unknown
Create a Home Valuation Report for This Property
The Home Valuation Report is an in-depth analysis detailing your home's value as well as a comparison with similar homes in the area
Home Values in the Area
Average Home Value in this Area
Purchase History
| Date | Buyer | Sale Price | Title Company |
|---|---|---|---|
| Kishore Stephanie A | $128,000 | -- | |
| Marino Salvatore N | $364,000 | -- | |
| Marino Salvatore N | -- | -- | |
| Fhlmc | -- | -- | |
| Nottingham David M | $132,500 | -- | |
| Dubois Kathleen M | $51,000 | -- |
Source: Public Records
Mortgage History
| Date | Status | Borrower | Loan Amount |
|---|---|---|---|
| Open | Kishore Stephanie A | $124,160 | |
| Previous Owner | Dubois Kathleen M | $136,000 | |
| Previous Owner | Dubois Kathleen M | $16,000 | |
| Previous Owner | Dubois Kathleen M | $48,450 |
Source: Public Records
Tax History Compared to Growth
Tax History
| Year | Tax Paid | Tax Assessment Tax Assessment Total Assessment is a certain percentage of the fair market value that is determined by local assessors to be the total taxable value of land and additions on the property. | Land | Improvement |
|---|---|---|---|---|
| 2025 | $4,000 | $118,730 | $0 | $118,730 |
| 2024 | $3,792 | $118,730 | $0 | $118,730 |
| 2023 | $3,567 | $118,730 | $0 | $118,730 |
| 2022 | $2,682 | $71,480 | $0 | $71,480 |
| 2021 | $2,675 | $71,480 | $0 | $71,480 |
| 2020 | $2,679 | $71,480 | $0 | $71,480 |
| 2019 | $2,694 | $71,480 | $0 | $71,480 |
| 2018 | $2,598 | $71,480 | $0 | $71,480 |
| 2017 | $2,585 | $72,930 | $0 | $72,930 |
| 2016 | $2,535 | $72,930 | $0 | $72,930 |
| 2015 | $2,481 | $72,930 | $0 | $72,930 |
| 2014 | $2,482 | $72,930 | $0 | $72,930 |
Source: Public Records
Map
Nearby Homes
- 14 Rising Trail Dr
- 52 Rising Trail Dr
- 36 Rising Trail Dr Unit 36
- 100 Rising Trail Dr Unit 100
- 162 Rising Trail Dr
- 123 Burgundy Hill Ln
- 36 Burgundy Hill Ln
- 48 Burgundy Hill Ln Unit 48
- 56 Burgundy Hill Ln Unit 56
- 38 Burgundy Hill Ln
- 229 Burgundy Hill Ln Unit 229
- 57 Burgundy Hill Ln
- 55 Trolley Crossing Ln Unit 55
- 3 Trolley Crossing Ln
- 170 Trolley Crossing Ln Unit 170
- 55 Timothy Dr
- 59 Inverness Ln
- 7 Inverness Square
- 886 East St
- 11 E Lake Dr
- 25 Rising Trail Ct
- 25 Rising Trail Ct Unit L
- 25 Rising Trail Ct Unit 25
- 27 Rising Trail Ct Unit 27
- 8 Rising Trail Ct
- 8 Rising Trail Ct Unit 8k
- 16 K Rising Trail Ct Unit 16K
- 6 Rising Trail Ct
- 6 Rising Trail Ct Unit 6
- 4 Rising Trail Ct
- 2 Rising Trail Ct
- 24 Rising Trail Ct
- 24 Rising Trail Ct Unit 24K
- 22 Rising Trail Ct
- 20 Rising Trail Ct
- 18 Rising Trail Ct
- 18 Rising Trail Ct Unit 18K
- 16 Rising Trail Ct
- 14 Rising Trail Ct
- 14 Rising Trail Ct Unit 14