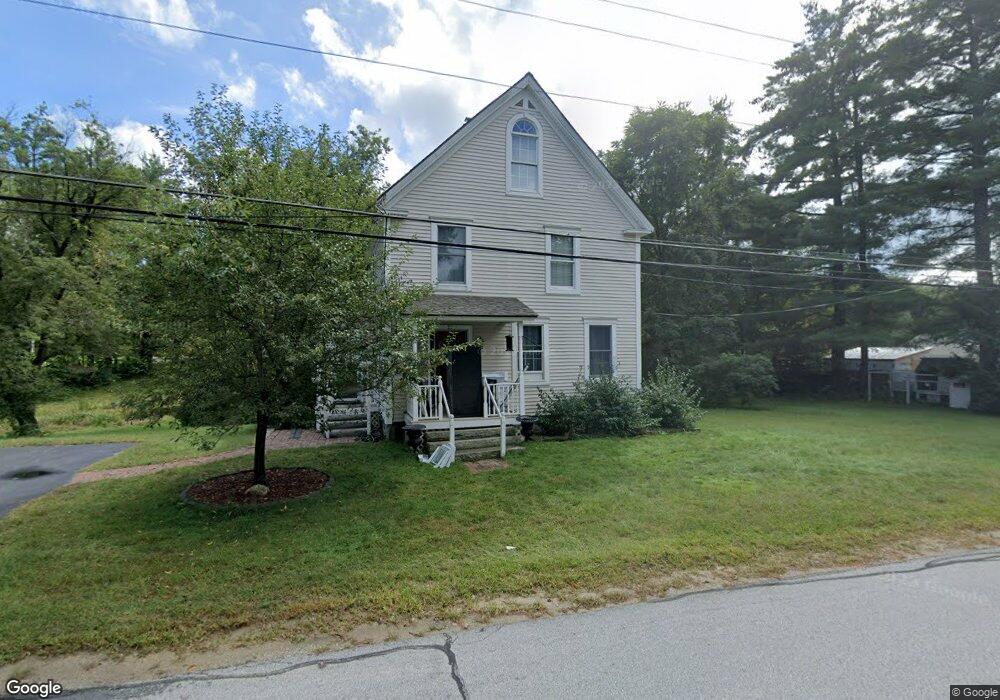
27 River Rd Allenstown, NH 03275
Estimated Value: $419,000 - $468,000
4
Beds
2
Baths
1,452
Sq Ft
$309/Sq Ft
Est. Value
About This Home
This home is located at 27 River Rd, Allenstown, NH 03275 and is currently estimated at $449,253, approximately $309 per square foot. 27 River Rd is a home located in Merrimack County with nearby schools including Allenstown Elementary School, Armand R. Dupont School, and Tender Years Child Care & Learning Center.
Ownership History
Date
Name
Owned For
Owner Type
Purchase Details
Closed on
Sep 29, 2021
Sold by
Baxter Dawna R and Chaput Dennis A
Bought by
Deangelis Mark
Current Estimated Value
Home Financials for this Owner
Home Financials are based on the most recent Mortgage that was taken out on this home.
Original Mortgage
$385,392
Outstanding Balance
$351,442
Interest Rate
2.8%
Mortgage Type
Purchase Money Mortgage
Estimated Equity
$97,811
Create a Home Valuation Report for This Property
The Home Valuation Report is an in-depth analysis detailing your home's value as well as a comparison with similar homes in the area
Home Values in the Area
Average Home Value in this Area
Purchase History
| Date | Buyer | Sale Price | Title Company |
|---|---|---|---|
| Deangelis Mark | $372,000 | None Available |
Source: Public Records
Mortgage History
| Date | Status | Borrower | Loan Amount |
|---|---|---|---|
| Open | Deangelis Mark | $385,392 |
Source: Public Records
Tax History Compared to Growth
Tax History
| Year | Tax Paid | Tax Assessment Tax Assessment Total Assessment is a certain percentage of the fair market value that is determined by local assessors to be the total taxable value of land and additions on the property. | Land | Improvement |
|---|---|---|---|---|
| 2024 | $9,594 | $377,400 | $149,000 | $228,400 |
| 2023 | $8,001 | $377,400 | $149,000 | $228,400 |
| 2022 | $7,359 | $377,400 | $149,000 | $228,400 |
| 2021 | $6,747 | $214,200 | $87,400 | $126,800 |
| 2020 | $6,024 | $205,600 | $87,400 | $118,200 |
| 2019 | $6,394 | $205,600 | $87,400 | $118,200 |
| 2018 | $6,478 | $205,600 | $87,400 | $118,200 |
| 2017 | $6,602 | $205,600 | $87,400 | $118,200 |
| 2016 | $5,851 | $172,800 | $59,600 | $113,200 |
| 2015 | $5,552 | $169,100 | $56,400 | $112,700 |
| 2014 | $5,712 | $169,100 | $56,400 | $112,700 |
| 2013 | $5,332 | $169,100 | $56,400 | $112,700 |
Source: Public Records
Map
Nearby Homes
- 19 Sullivan Dr
- 1 1/2 Bartlett St
- 10 Lane Dr
- 2 Cheryl Dr
- 422 Dawn Dr Unit 23
- 427 Dawn Dr Unit 15
- 111 Glass St
- 15 Sullivan Dr
- 12-14 Church St Unit 12,14
- 100 Main St Unit M10
- 100 Main St Unit 204
- 15 Main St
- 4 Rodger Rd
- 7 Ferry St
- 307 Dearborn Rd
- 233 Pembroke St
- 9 Pine Acres Rd
- 259 Pembroke St
- 1821 Hooksett Rd
- 10 Northview Terrace