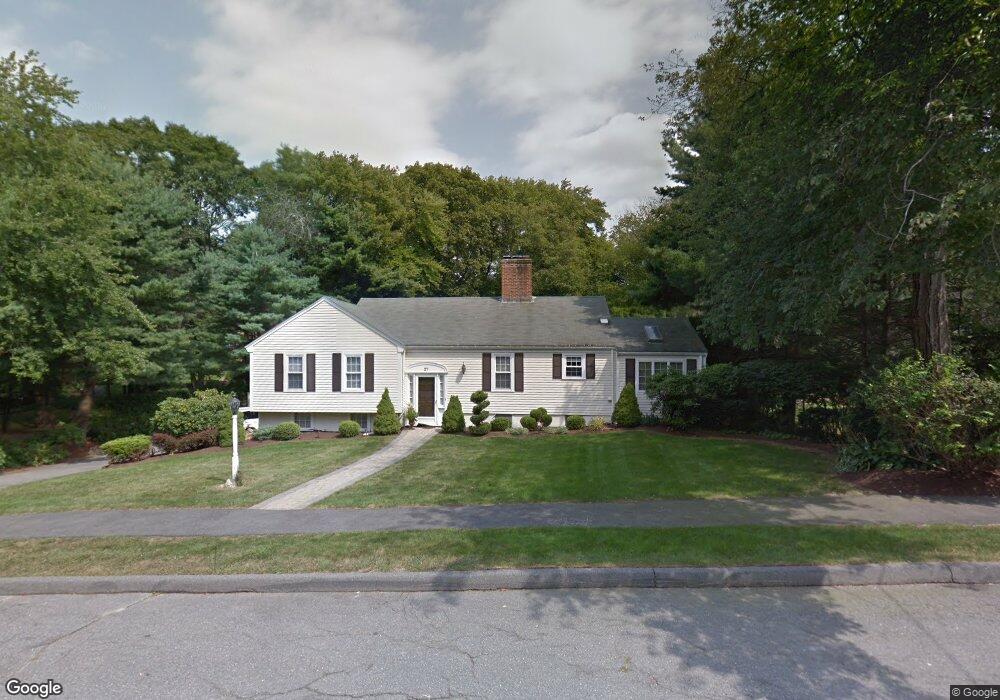
27 Robin Rd Lynnfield, MA 01940
Estimated Value: $959,000 - $1,454,000
3
Beds
3
Baths
2,352
Sq Ft
$521/Sq Ft
Est. Value
About This Home
This home is located at 27 Robin Rd, Lynnfield, MA 01940 and is currently estimated at $1,224,436, approximately $520 per square foot. 27 Robin Rd is a home located in Essex County with nearby schools including Lynnfield Middle School, Lynnfield High School, and Our Lady Of Assumption School.
Ownership History
Date
Name
Owned For
Owner Type
Purchase Details
Closed on
Sep 24, 2007
Sold by
Gregory Julie A and Gregory Robert J
Bought by
Mazzone Joann and Mazzone Marc C
Current Estimated Value
Home Financials for this Owner
Home Financials are based on the most recent Mortgage that was taken out on this home.
Original Mortgage
$417,000
Outstanding Balance
$264,827
Interest Rate
6.63%
Mortgage Type
Purchase Money Mortgage
Estimated Equity
$959,609
Purchase Details
Closed on
Nov 20, 2000
Sold by
Pasquerella Ralph J and Pasquerella Judith A
Bought by
Gregory Robert J and Gregory Julie A
Create a Home Valuation Report for This Property
The Home Valuation Report is an in-depth analysis detailing your home's value as well as a comparison with similar homes in the area
Home Values in the Area
Average Home Value in this Area
Purchase History
| Date | Buyer | Sale Price | Title Company |
|---|---|---|---|
| Mazzone Joann | $610,000 | -- | |
| Gregory Robert J | $375,000 | -- |
Source: Public Records
Mortgage History
| Date | Status | Borrower | Loan Amount |
|---|---|---|---|
| Open | Mazzone Joann | $417,000 |
Source: Public Records
Tax History
| Year | Tax Paid | Tax Assessment Tax Assessment Total Assessment is a certain percentage of the fair market value that is determined by local assessors to be the total taxable value of land and additions on the property. | Land | Improvement |
|---|---|---|---|---|
| 2025 | $14,239 | $1,348,400 | $564,500 | $783,900 |
| 2024 | $13,681 | $1,301,700 | $542,800 | $758,900 |
| 2023 | $13,447 | $1,190,000 | $514,800 | $675,200 |
| 2022 | $12,628 | $1,053,200 | $472,800 | $580,400 |
| 2021 | $12,450 | $938,200 | $385,300 | $552,900 |
| 2020 | $12,502 | $898,100 | $345,100 | $553,000 |
| 2019 | $12,437 | $894,100 | $345,100 | $549,000 |
| 2018 | $8,782 | $638,200 | $345,100 | $293,100 |
| 2017 | $8,625 | $625,900 | $332,800 | $293,100 |
| 2016 | $8,126 | $560,400 | $285,600 | $274,800 |
| 2015 | $8,104 | $559,300 | $284,500 | $274,800 |
Source: Public Records
Map
Nearby Homes
- 33 Rockwood Rd
- 715 Summer St
- 741 Salem St
- 344 Broadway
- 903 Foxwood Cir Unit 903
- 114 Lake St
- 103 Foxwood Cir
- 37 Locust St
- 143 Winona St
- 19 Lindauer St
- 60r Lynnbrook Rd
- 1200 Salem St Unit 190
- 1200 Salem St Unit 168
- 1200 Salem St Unit 151
- 9 Broadway Unit 210
- 12 Mansfield St
- 11 Elizabeth Way
- 410 Salem St Unit 1203
- 161 Newbury St Unit 32
- 165 Newbury St Unit 4
Your Personal Tour Guide
Ask me questions while you tour the home.