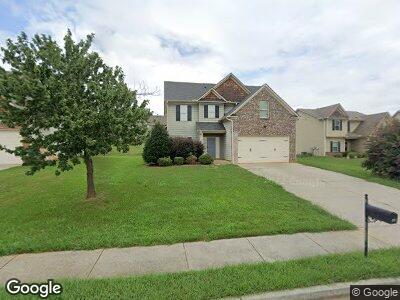
27 Rosen St NW Cartersville, GA 30120
Estimated Value: $336,424 - $363,000
3
Beds
3
Baths
2,002
Sq Ft
$175/Sq Ft
Est. Value
About This Home
This home is located at 27 Rosen St NW, Cartersville, GA 30120 and is currently estimated at $349,606, approximately $174 per square foot. 27 Rosen St NW is a home located in Bartow County with nearby schools including Hamilton Crossing Elementary School, Cass Middle School, and Cass High School.
Ownership History
Date
Name
Owned For
Owner Type
Purchase Details
Closed on
Nov 3, 2015
Sold by
Freo Georgia Llc
Bought by
Progress Residential 2015 3 Bo
Current Estimated Value
Home Financials for this Owner
Home Financials are based on the most recent Mortgage that was taken out on this home.
Original Mortgage
$449,712,992
Interest Rate
3.78%
Mortgage Type
New Conventional
Purchase Details
Closed on
Apr 19, 2013
Sold by
J & A Construction & Homebui
Bought by
Freo Georgia Llc
Create a Home Valuation Report for This Property
The Home Valuation Report is an in-depth analysis detailing your home's value as well as a comparison with similar homes in the area
Home Values in the Area
Average Home Value in this Area
Purchase History
| Date | Buyer | Sale Price | Title Company |
|---|---|---|---|
| Progress Residential 2015 3 Bo | -- | -- | |
| Freo Georgia Llc | $133,000 | -- |
Source: Public Records
Mortgage History
| Date | Status | Borrower | Loan Amount |
|---|---|---|---|
| Closed | Progress Residential 2015 3 Bo | $449,712,992 |
Source: Public Records
Tax History Compared to Growth
Tax History
| Year | Tax Paid | Tax Assessment Tax Assessment Total Assessment is a certain percentage of the fair market value that is determined by local assessors to be the total taxable value of land and additions on the property. | Land | Improvement |
|---|---|---|---|---|
| 2024 | $3,307 | $136,083 | $26,000 | $110,083 |
| 2023 | $3,307 | $135,294 | $26,000 | $109,294 |
| 2022 | $2,523 | $99,386 | $14,000 | $85,386 |
| 2021 | $1,994 | $74,749 | $14,000 | $60,749 |
| 2020 | $1,943 | $70,749 | $10,000 | $60,749 |
| 2019 | $1,754 | $63,200 | $10,000 | $53,200 |
| 2018 | $1,761 | $63,200 | $10,000 | $53,200 |
| 2017 | $1,826 | $65,200 | $10,316 | $54,884 |
| 2016 | $1,839 | $65,200 | $12,000 | $53,200 |
| 2015 | $1,843 | $65,200 | $12,000 | $53,200 |
| 2014 | -- | $52,840 | $10,400 | $42,440 |
| 2013 | -- | $10,400 | $10,400 | $0 |
Source: Public Records
Map
Nearby Homes