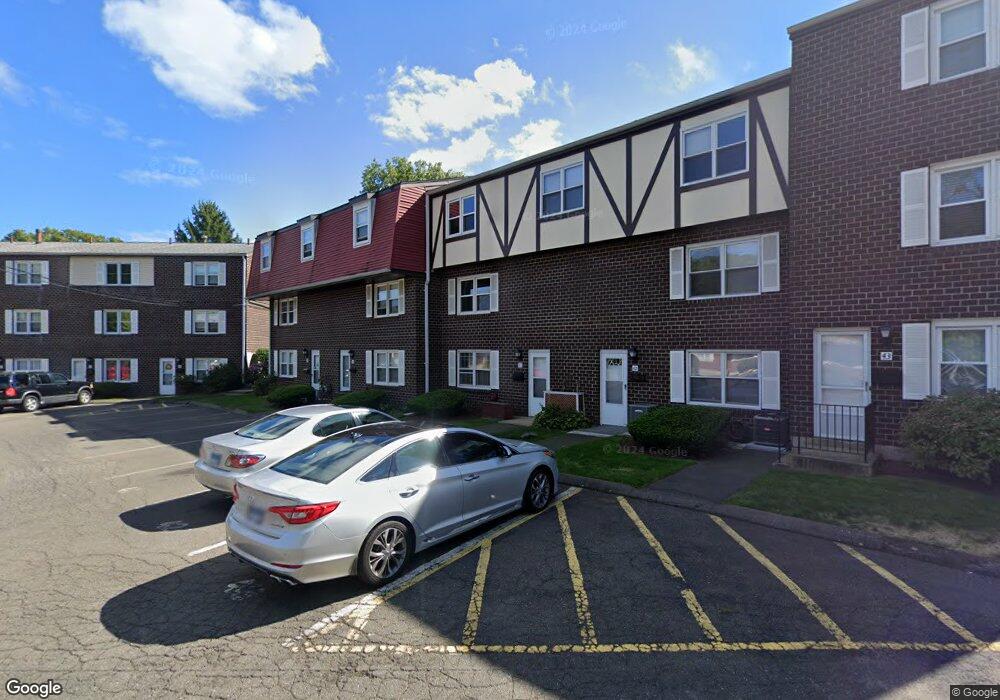
27 Savin Park West Haven, CT 06516
West Haven Center NeighborhoodEstimated Value: $275,000 - $315,000
3
Beds
2
Baths
1,386
Sq Ft
$212/Sq Ft
Est. Value
About This Home
This home is located at 27 Savin Park, West Haven, CT 06516 and is currently estimated at $293,407, approximately $211 per square foot. 27 Savin Park is a home located in New Haven County with nearby schools including Carrigan 5/6 Intermediate School, Harry M. Bailey Middle School, and West Haven High School.
Ownership History
Date
Name
Owned For
Owner Type
Purchase Details
Closed on
Dec 2, 2013
Sold by
Batista Angelo and Batista Joann
Bought by
Sidbury Porsha
Current Estimated Value
Home Financials for this Owner
Home Financials are based on the most recent Mortgage that was taken out on this home.
Original Mortgage
$135,850
Outstanding Balance
$99,585
Interest Rate
4.29%
Estimated Equity
$193,822
Purchase Details
Closed on
Aug 16, 2002
Sold by
Mendizabal Iker
Bought by
Batista Angelo and Batista Joan
Home Financials for this Owner
Home Financials are based on the most recent Mortgage that was taken out on this home.
Original Mortgage
$111,200
Interest Rate
6.61%
Purchase Details
Closed on
Feb 27, 2001
Sold by
Koepke Rita A
Bought by
Mendizabal Iker
Create a Home Valuation Report for This Property
The Home Valuation Report is an in-depth analysis detailing your home's value as well as a comparison with similar homes in the area
Home Values in the Area
Average Home Value in this Area
Purchase History
| Date | Buyer | Sale Price | Title Company |
|---|---|---|---|
| Sidbury Porsha | $143,000 | -- | |
| Batista Angelo | $139,000 | -- | |
| Mendizabal Iker | $109,000 | -- |
Source: Public Records
Mortgage History
| Date | Status | Borrower | Loan Amount |
|---|---|---|---|
| Open | Mendizabal Iker | $135,850 | |
| Previous Owner | Mendizabal Iker | $140,000 | |
| Previous Owner | Mendizabal Iker | $111,200 |
Source: Public Records
Tax History Compared to Growth
Tax History
| Year | Tax Paid | Tax Assessment Tax Assessment Total Assessment is a certain percentage of the fair market value that is determined by local assessors to be the total taxable value of land and additions on the property. | Land | Improvement |
|---|---|---|---|---|
| 2025 | $5,153 | $149,240 | $0 | $149,240 |
| 2024 | $5,030 | $103,670 | $0 | $103,670 |
| 2023 | $4,822 | $103,670 | $0 | $103,670 |
| 2022 | $4,727 | $103,670 | $0 | $103,670 |
| 2021 | $4,727 | $103,670 | $0 | $103,670 |
| 2020 | $6,229 | $123,410 | $0 | $123,410 |
| 2019 | $6,006 | $123,410 | $0 | $123,410 |
| 2018 | $5,955 | $123,410 | $0 | $123,410 |
| 2017 | $5,635 | $123,410 | $0 | $123,410 |
| 2016 | $5,623 | $123,410 | $0 | $123,410 |
| 2015 | $4,997 | $123,830 | $0 | $123,830 |
| 2014 | $4,966 | $123,830 | $0 | $123,830 |
Source: Public Records
Map
Nearby Homes