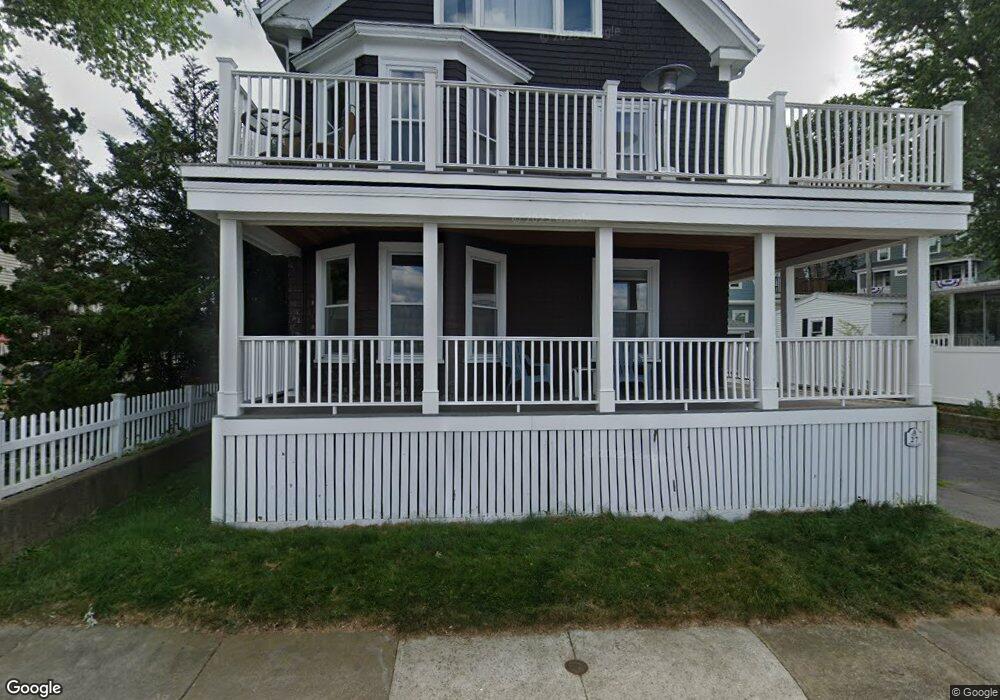
27 Shore Ave Unit 2 Salem, MA 01970
South Salem NeighborhoodEstimated Value: $1,031,000 - $1,524,000
2
Beds
1
Bath
1,070
Sq Ft
$1,143/Sq Ft
Est. Value
About This Home
This home is located at 27 Shore Ave Unit 2, Salem, MA 01970 and is currently estimated at $1,223,336, approximately $1,143 per square foot. 27 Shore Ave Unit 2 is a home located in Essex County with nearby schools including Saltonstall School, Carlton Elementary School, and Horace Mann Laboratory.
Ownership History
Date
Name
Owned For
Owner Type
Purchase Details
Closed on
Jul 26, 2024
Sold by
Conway Tyler J
Bought by
Orchard Rt and Conway
Current Estimated Value
Purchase Details
Closed on
Sep 26, 2016
Sold by
Call-Marron Elaine
Bought by
Conway Tyler J
Home Financials for this Owner
Home Financials are based on the most recent Mortgage that was taken out on this home.
Original Mortgage
$572,000
Interest Rate
3.45%
Mortgage Type
Purchase Money Mortgage
Purchase Details
Closed on
Mar 21, 1984
Bought by
Call Elaine A
Create a Home Valuation Report for This Property
The Home Valuation Report is an in-depth analysis detailing your home's value as well as a comparison with similar homes in the area
Home Values in the Area
Average Home Value in this Area
Purchase History
| Date | Buyer | Sale Price | Title Company |
|---|---|---|---|
| Orchard Rt | -- | None Available | |
| Orchard Rt | -- | None Available | |
| Conway Tyler J | $715,000 | -- | |
| Call Elaine A | -- | -- |
Source: Public Records
Mortgage History
| Date | Status | Borrower | Loan Amount |
|---|---|---|---|
| Previous Owner | Conway Tyler J | $572,000 | |
| Previous Owner | Call Elaine A | $200,000 |
Source: Public Records
Tax History Compared to Growth
Tax History
| Year | Tax Paid | Tax Assessment Tax Assessment Total Assessment is a certain percentage of the fair market value that is determined by local assessors to be the total taxable value of land and additions on the property. | Land | Improvement |
|---|---|---|---|---|
| 2025 | $13,667 | $1,205,200 | $405,300 | $799,900 |
| 2024 | $12,705 | $1,093,400 | $385,100 | $708,300 |
| 2023 | $12,470 | $996,800 | $355,500 | $641,300 |
| 2022 | $12,150 | $917,000 | $343,700 | $573,300 |
| 2021 | $11,675 | $846,000 | $320,000 | $526,000 |
| 2020 | $10,988 | $760,400 | $302,200 | $458,200 |
| 2019 | $10,899 | $721,800 | $286,800 | $435,000 |
| 2018 | $10,171 | $661,300 | $272,600 | $388,700 |
| 2017 | $7,984 | $503,400 | $201,200 | $302,200 |
| 2016 | $7,003 | $446,900 | $164,400 | $282,500 |
| 2015 | $6,822 | $415,700 | $151,100 | $264,600 |
Source: Public Records
Map
Nearby Homes
- 17 Cliff St
- 4 Willow Ave Unit 2
- 327 Lafayette St Unit 2
- 9 Glover St Unit 1
- 24 Wisteria St Unit 2
- 10 Hazel St Unit 2
- 14 Meadow St
- 2A Hazel St Unit 3
- 16 Leavitt St Unit 2
- 7 Fairfield St
- 9 Lyme St
- 25 Perkins St
- 32 Park St
- 436 Lafayette St
- 288-292 Washington & 5 Porter St Ct
- 39 1/2 Harbor St Unit 1
- 263 Jefferson Ave
- 86 Wharf St Unit 6
- 25 Calabrese St
- 10 Horton St