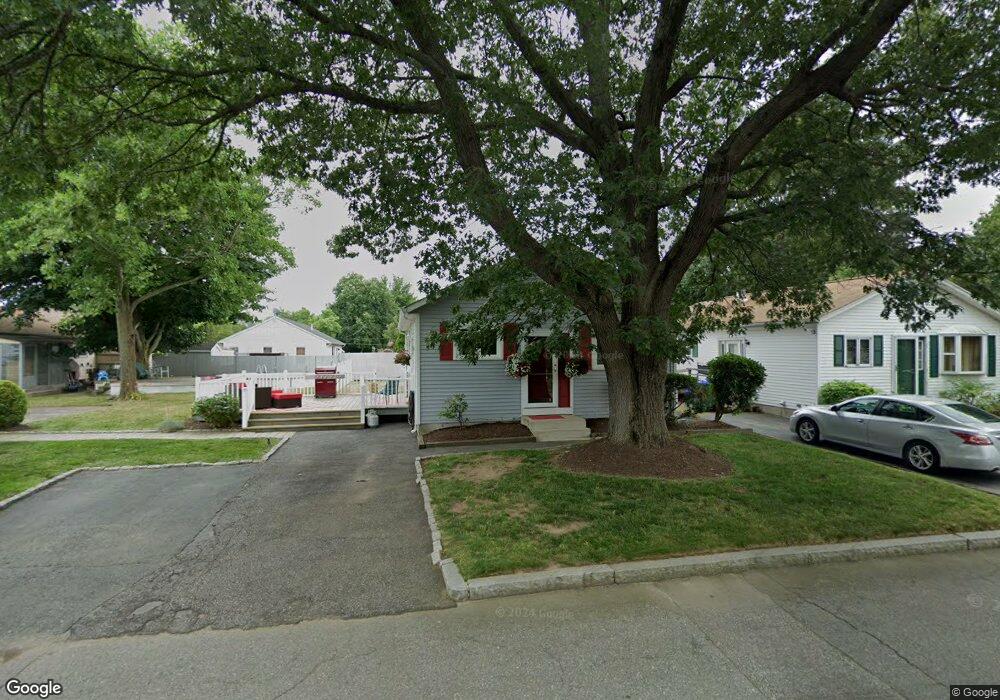
27 Swanton St Cranston, RI 02910
Estimated Value: $310,000 - $400,000
3
Beds
1
Bath
1,500
Sq Ft
$244/Sq Ft
Est. Value
About This Home
This home is located at 27 Swanton St, Cranston, RI 02910 and is currently estimated at $366,522, approximately $244 per square foot. 27 Swanton St is a home located in Providence County with nearby schools including Asa Messer Elementary School, Charles N. Fortes Elementary School, and Alfred Lima Sr. Elementary School.
Ownership History
Date
Name
Owned For
Owner Type
Purchase Details
Closed on
Oct 21, 2023
Sold by
Casali Deborah K and Casali Joseph A
Bought by
Casali Deborah K
Current Estimated Value
Home Financials for this Owner
Home Financials are based on the most recent Mortgage that was taken out on this home.
Original Mortgage
$198,412
Interest Rate
7.18%
Mortgage Type
FHA
Purchase Details
Closed on
Oct 26, 2016
Sold by
Summit Realty Llc
Bought by
Casali Deborah
Home Financials for this Owner
Home Financials are based on the most recent Mortgage that was taken out on this home.
Original Mortgage
$12,000
Interest Rate
3.5%
Mortgage Type
New Conventional
Purchase Details
Closed on
Oct 9, 2001
Sold by
Breen Kerri E
Bought by
Casali Joseph A and Casali Deborah K
Purchase Details
Closed on
Apr 19, 1990
Sold by
Est Ciaramello Frank
Bought by
Sciarra Lawrence
Create a Home Valuation Report for This Property
The Home Valuation Report is an in-depth analysis detailing your home's value as well as a comparison with similar homes in the area
Home Values in the Area
Average Home Value in this Area
Purchase History
| Date | Buyer | Sale Price | Title Company |
|---|---|---|---|
| Casali Deborah K | -- | None Available | |
| Casali Deborah K | -- | None Available | |
| Casali Deborah K | -- | None Available | |
| Casali Deborah K | -- | None Available | |
| Casali Deborah | $12,000 | -- | |
| Casali Joseph A | $90,500 | -- | |
| Sciarra Lawrence | $145,000 | -- | |
| Casali Deborah | $12,000 | -- | |
| Casali Joseph A | $90,500 | -- | |
| Sciarra Lawrence | $145,000 | -- |
Source: Public Records
Mortgage History
| Date | Status | Borrower | Loan Amount |
|---|---|---|---|
| Previous Owner | Casali Deborah K | $198,412 | |
| Previous Owner | Casali Deborah | $12,000 | |
| Previous Owner | Sciarra Lawrence | $135,000 |
Source: Public Records
Tax History Compared to Growth
Tax History
| Year | Tax Paid | Tax Assessment Tax Assessment Total Assessment is a certain percentage of the fair market value that is determined by local assessors to be the total taxable value of land and additions on the property. | Land | Improvement |
|---|---|---|---|---|
| 2025 | $2,662 | $316,900 | $127,000 | $189,900 |
| 2024 | $4,589 | $250,100 | $85,400 | $164,700 |
| 2023 | $4,589 | $250,100 | $85,400 | $164,700 |
| 2022 | $4,452 | $250,100 | $85,400 | $164,700 |
| 2021 | $4,124 | $167,900 | $54,400 | $113,500 |
| 2020 | $4,124 | $167,900 | $54,400 | $113,500 |
| 2019 | $4,124 | $167,900 | $54,400 | $113,500 |
| 2018 | $4,295 | $134,400 | $49,500 | $84,900 |
| 2017 | $4,295 | $134,400 | $49,500 | $84,900 |
| 2016 | $4,295 | $134,400 | $49,500 | $84,900 |
| 2015 | $3,750 | $113,300 | $38,500 | $74,800 |
| 2014 | $3,824 | $113,300 | $38,500 | $74,800 |
| 2013 | $3,824 | $113,300 | $38,500 | $74,800 |
Source: Public Records
Map
Nearby Homes
- 6 Tobyhanna St
- 444 Niantic Ave
- 11 Togansett Rd
- 26 Westmore St
- 29 Crescent St
- 41 Cottage St
- 35 Humes St
- 16 Winthrop St
- 12 Winthrop St
- 32 Stadden St
- 354 Adelaide Ave
- 165 Rounds Ave
- 30 Pomham St
- 136 Frankfort St
- 74 Lake St Unit 76
- 137 Rutherglen Ave
- 166 Midwood St
- 60 Lowell St
- 145 Harmon Ave
- 210 Crescent Ave
- 23 Swanton St
- 20 Tobyhanna St
- 22 Tobyhanna St
- 54 Lakeview Dr
- 18 Tobyhanna St
- 59 Lakeview Dr
- 16 Tobyhanna St
- 11 Swanton St
- 40 Lakeview Dr
- 25 Tobyhanna St
- 50 Lakeview Dr
- 37 Tobyhanna St
- 43 Lakeview Dr
- 17 Tobyhanna St
- 34 Lakeview Dr
- 426 Niantic Ave
- 430 Niantic Ave
- 434 Niantic Ave
- 65 Lakeview Dr
- 41 Tobyhanna St