27 Texas Ave Houma, LA 70360
Mulberry NeighborhoodEstimated Value: $148,638 - $218,000
3
Beds
2
Baths
1,423
Sq Ft
$131/Sq Ft
Est. Value
About This Home
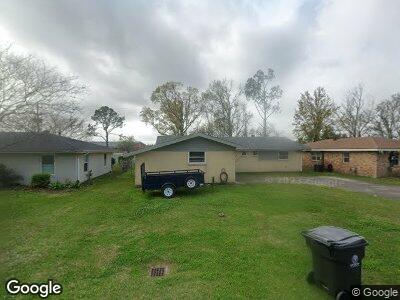
This home is located at 27 Texas Ave, Houma, LA 70360 and is currently estimated at $186,910, approximately $131 per square foot. 27 Texas Ave is a home located in Terrebonne Parish with nearby schools including Mulberry Elementary School, Houma Junior High School, and Terrebonne High School.
Ownership History
Date
Name
Owned For
Owner Type
Purchase Details
Closed on
Dec 10, 2019
Sold by
Bourgeois Erin T
Bought by
Naquin Josh J
Current Estimated Value
Home Financials for this Owner
Home Financials are based on the most recent Mortgage that was taken out on this home.
Original Mortgage
$171,616
Outstanding Balance
$153,334
Interest Rate
3.75%
Mortgage Type
Purchase Money Mortgage
Estimated Equity
$33,576
Purchase Details
Closed on
Jan 8, 2016
Sold by
Bourgeois William C
Bought by
Gros Erin Bourgeois and Bourgeois Erin Theresa
Create a Home Valuation Report for This Property
The Home Valuation Report is an in-depth analysis detailing your home's value as well as a comparison with similar homes in the area
Home Values in the Area
Average Home Value in this Area
Purchase History
| Date | Buyer | Sale Price | Title Company |
|---|---|---|---|
| Naquin Josh J | $169,900 | None Available | |
| Gros Erin Bourgeois | -- | Stone Title |
Source: Public Records
Mortgage History
| Date | Status | Borrower | Loan Amount |
|---|---|---|---|
| Open | Naquin Josh J | $171,616 |
Source: Public Records
Tax History Compared to Growth
Tax History
| Year | Tax Paid | Tax Assessment Tax Assessment Total Assessment is a certain percentage of the fair market value that is determined by local assessors to be the total taxable value of land and additions on the property. | Land | Improvement |
|---|---|---|---|---|
| 2024 | $622 | $12,580 | $3,310 | $9,270 |
| 2023 | $622 | $11,580 | $2,750 | $8,830 |
| 2022 | $512 | $11,580 | $2,750 | $8,830 |
| 2021 | $421 | $10,700 | $2,750 | $7,950 |
| 2020 | $1,039 | $11,580 | $2,750 | $8,830 |
| 2019 | $1,089 | $11,220 | $2,390 | $8,830 |
| 2018 | $391 | $10,690 | $2,280 | $8,410 |
| 2017 | $893 | $10,690 | $2,280 | $8,410 |
| 2015 | $333 | $10,180 | $2,175 | $8,005 |
| 2014 | $512 | $10,180 | $0 | $0 |
| 2013 | $512 | $10,180 | $0 | $0 |
Source: Public Records
Map
Nearby Homes