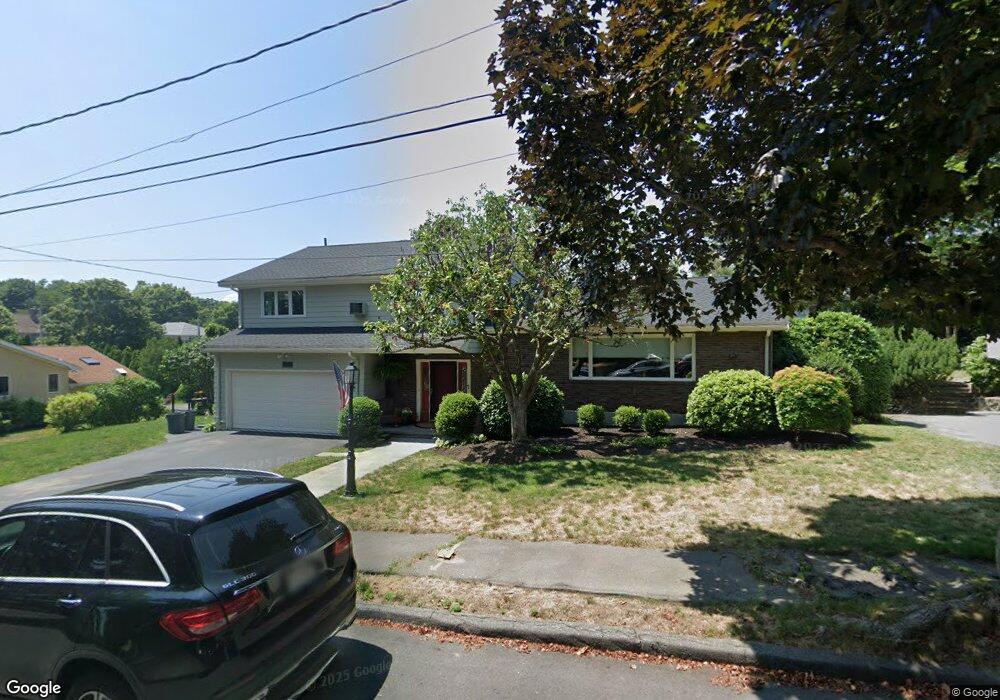
27 Thompson Rd Marblehead, MA 01945
Estimated Value: $1,047,000 - $1,150,000
3
Beds
3
Baths
2,649
Sq Ft
$415/Sq Ft
Est. Value
About This Home
This home is located at 27 Thompson Rd, Marblehead, MA 01945 and is currently estimated at $1,100,541, approximately $415 per square foot. 27 Thompson Rd is a home located in Essex County with nearby schools including Marblehead High School, Devereux School, and Tower School.
Ownership History
Date
Name
Owned For
Owner Type
Purchase Details
Closed on
May 22, 2024
Sold by
Horgan Donna R and Horgan Paul A
Bought by
Horgan Ft and Horgan
Current Estimated Value
Purchase Details
Closed on
Jul 14, 1993
Sold by
Hibernia N B
Bought by
Horgan Donna Reed
Purchase Details
Closed on
Sep 29, 1992
Sold by
Sonne Leonard
Bought by
Hibernia Nb
Create a Home Valuation Report for This Property
The Home Valuation Report is an in-depth analysis detailing your home's value as well as a comparison with similar homes in the area
Home Values in the Area
Average Home Value in this Area
Purchase History
| Date | Buyer | Sale Price | Title Company |
|---|---|---|---|
| Horgan Ft | -- | None Available | |
| Horgan Ft | -- | None Available | |
| Horgan Ft | -- | None Available | |
| Horgan Ft | -- | None Available | |
| Horgan Donna Reed | $205,000 | -- | |
| Hibernia Nb | $70,000 | -- | |
| Horgan Donna Reed | $205,000 | -- | |
| Hibernia Nb | $70,000 | -- |
Source: Public Records
Mortgage History
| Date | Status | Borrower | Loan Amount |
|---|---|---|---|
| Previous Owner | Hibernia Nb | $200,000 | |
| Previous Owner | Hibernia Nb | $150,000 |
Source: Public Records
Tax History
| Year | Tax Paid | Tax Assessment Tax Assessment Total Assessment is a certain percentage of the fair market value that is determined by local assessors to be the total taxable value of land and additions on the property. | Land | Improvement |
|---|---|---|---|---|
| 2025 | $9,009 | $995,500 | $603,100 | $392,400 |
| 2024 | $8,771 | $978,900 | $616,500 | $362,400 |
| 2023 | $8,668 | $866,800 | $542,800 | $324,000 |
| 2022 | $8,273 | $786,400 | $482,500 | $303,900 |
| 2021 | $7,863 | $754,600 | $455,700 | $298,900 |
| 2020 | $7,383 | $710,600 | $455,700 | $254,900 |
| 2019 | $7,200 | $670,400 | $415,500 | $254,900 |
| 2018 | $7,092 | $643,600 | $388,700 | $254,900 |
| 2017 | $6,939 | $630,200 | $375,300 | $254,900 |
| 2016 | $6,698 | $603,400 | $348,500 | $254,900 |
| 2015 | $6,126 | $552,900 | $294,800 | $258,100 |
| 2014 | $5,881 | $530,300 | $268,000 | $262,300 |
Source: Public Records
Map
Nearby Homes
- 34 Lafayette St
- 4 Dean Rd
- 282 Pleasant St
- 33 W Shore Dr
- 16 Pickwick Rd
- 12 Pickwick Rd
- 70 Maverick St
- 212 Humphrey St Unit 205
- 11 Angenica Terrace
- 30 Haley Rd Unit 1
- 23 Wyman Rd
- 7 Cottage St
- 41 Atlantic Ave Unit 1
- 290 Washington St Unit A
- 6 Mount Vernon St
- 4 Fairview Rd
- 55 Brackett Place Unit B
- 469 Loring Ave
- 55 Roosevelt Ave
- 1 Knollwood Rd
Your Personal Tour Guide
Ask me questions while you tour the home.