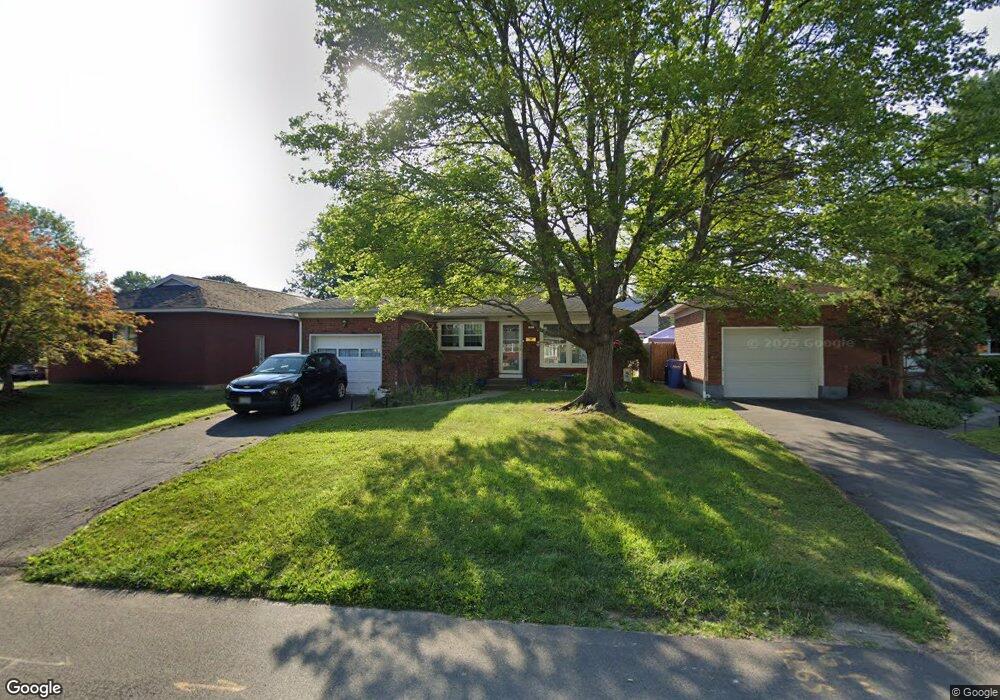
27 Tryon St Albany, NY 12203
Campus Area NeighborhoodEstimated Value: $215,000 - $294,629
3
Beds
2
Baths
1,040
Sq Ft
$250/Sq Ft
Est. Value
About This Home
This home is located at 27 Tryon St, Albany, NY 12203 and is currently estimated at $259,907, approximately $249 per square foot. 27 Tryon St is a home located in Albany County with nearby schools including Eagle Point Elementary School, William S Hackett Middle School, and Albany High School.
Ownership History
Date
Name
Owned For
Owner Type
Purchase Details
Closed on
Jul 22, 2024
Sold by
Page Charles W and Burrows Michael T
Bought by
Schramm Michaela
Current Estimated Value
Home Financials for this Owner
Home Financials are based on the most recent Mortgage that was taken out on this home.
Original Mortgage
$180,000
Outstanding Balance
$177,834
Interest Rate
6.95%
Mortgage Type
New Conventional
Estimated Equity
$82,073
Purchase Details
Closed on
Jul 15, 2014
Sold by
Burrows Daniel J and Burrows Michael T
Bought by
Burrows Michael T and Page Charles W
Purchase Details
Closed on
Jun 8, 2012
Sold by
Burrows Anne M
Bought by
Burrows Michael T and Burrows Daniel J
Create a Home Valuation Report for This Property
The Home Valuation Report is an in-depth analysis detailing your home's value as well as a comparison with similar homes in the area
Home Values in the Area
Average Home Value in this Area
Purchase History
| Date | Buyer | Sale Price | Title Company |
|---|---|---|---|
| Schramm Michaela | -- | Pac Abstract | |
| Burrows Michael T | -- | None Available | |
| Burrows Michael T | -- | None Available |
Source: Public Records
Mortgage History
| Date | Status | Borrower | Loan Amount |
|---|---|---|---|
| Open | Schramm Michaela | $180,000 |
Source: Public Records
Tax History Compared to Growth
Tax History
| Year | Tax Paid | Tax Assessment Tax Assessment Total Assessment is a certain percentage of the fair market value that is determined by local assessors to be the total taxable value of land and additions on the property. | Land | Improvement |
|---|---|---|---|---|
| 2024 | $5,781 | $223,000 | $44,600 | $178,400 |
| 2023 | $7,170 | $177,000 | $35,000 | $142,000 |
| 2022 | $7,264 | $177,000 | $35,000 | $142,000 |
| 2021 | $7,249 | $177,000 | $35,000 | $142,000 |
| 2020 | $7,357 | $177,000 | $35,000 | $142,000 |
| 2019 | $6,968 | $177,000 | $35,000 | $142,000 |
| 2018 | $7,458 | $177,000 | $35,000 | $142,000 |
| 2017 | $3,229 | $177,000 | $35,000 | $142,000 |
| 2016 | $7,188 | $177,000 | $35,000 | $142,000 |
| 2015 | $6,496 | $181,300 | $36,300 | $145,000 |
| 2014 | -- | $181,300 | $36,300 | $145,000 |
Source: Public Records
Map
Nearby Homes