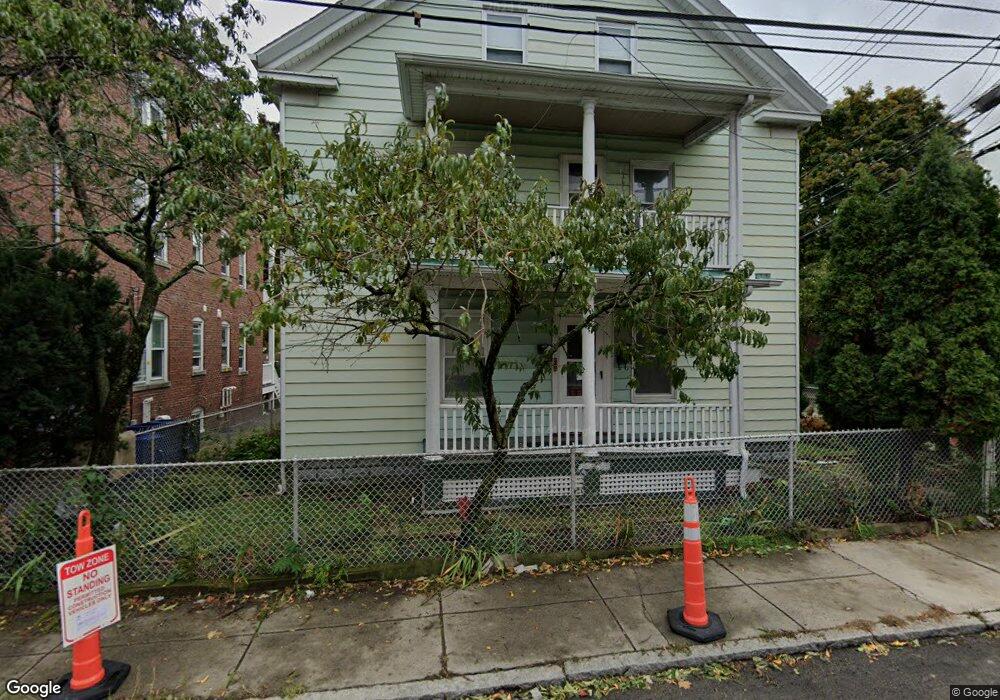
27 Waverly St Brighton, MA 02135
Allston NeighborhoodEstimated Value: $1,144,000 - $1,538,948
4
Beds
5
Baths
999
Sq Ft
$1,375/Sq Ft
Est. Value
About This Home
Welcome to 27 Waverly Street #1, a stunning residence in the heart of North Brighton. This immaculate 4-bedroom, 2-bathroom unit boasts a harmonious blend of modern elegance and classic charm, providing a luxurious and comfortable living experience. Upon entering, you'll be greeted by the warmth of gleaming hardwood floors that flow seamlessly throughout the open-concept living space. The kitchen, adorned with stainless steel appliances and modern finishes, is a culinary haven where you can unleash creativity. 73201 688
Ownership History
Date
Name
Owned For
Owner Type
Purchase Details
Closed on
Mar 31, 2023
Sold by
Ng Simon Tze-Pui Est and Chen
Bought by
Cui Lixia and Li Chang
Current Estimated Value
Home Financials for this Owner
Home Financials are based on the most recent Mortgage that was taken out on this home.
Original Mortgage
$540,000
Outstanding Balance
$523,026
Interest Rate
6.32%
Mortgage Type
Purchase Money Mortgage
Estimated Equity
$850,961
Purchase Details
Closed on
Jun 7, 2018
Sold by
Ng Che M
Bought by
Ng Simon T
Create a Home Valuation Report for This Property
The Home Valuation Report is an in-depth analysis detailing your home's value as well as a comparison with similar homes in the area
Home Values in the Area
Average Home Value in this Area
Purchase History
| Date | Buyer | Sale Price | Title Company |
|---|---|---|---|
| Cui Lixia | $950,000 | None Available | |
| Ng Simon T | -- | -- |
Source: Public Records
Mortgage History
| Date | Status | Borrower | Loan Amount |
|---|---|---|---|
| Open | Cui Lixia | $540,000 |
Source: Public Records
Property History
| Date | Event | Price | List to Sale | Price per Sq Ft |
|---|---|---|---|---|
| 10/08/2024 10/08/24 | Off Market | $4,400 | -- | -- |
| 05/31/2024 05/31/24 | For Rent | $4,400 | -- | -- |
Tax History Compared to Growth
Tax History
| Year | Tax Paid | Tax Assessment Tax Assessment Total Assessment is a certain percentage of the fair market value that is determined by local assessors to be the total taxable value of land and additions on the property. | Land | Improvement |
|---|---|---|---|---|
| 2025 | $15,484 | $1,337,100 | $313,900 | $1,023,200 |
| 2024 | $11,722 | $1,075,400 | $316,900 | $758,500 |
| 2023 | $10,996 | $1,023,800 | $301,700 | $722,100 |
| 2022 | $10,813 | $993,800 | $292,900 | $700,900 |
| 2021 | $10,004 | $937,600 | $276,300 | $661,300 |
| 2020 | $9,634 | $912,300 | $231,200 | $681,100 |
| 2019 | $9,108 | $864,100 | $198,100 | $666,000 |
| 2018 | $9,056 | $864,100 | $198,100 | $666,000 |
| 2017 | $9,060 | $855,500 | $198,100 | $657,400 |
| 2016 | $8,555 | $777,700 | $198,100 | $579,600 |
| 2015 | $7,027 | $580,300 | $180,600 | $399,700 |
| 2014 | $6,223 | $494,700 | $180,600 | $314,100 |
Source: Public Records
Map
Nearby Homes
- 26 Waverly St Unit 410
- 42 Waverly St Unit M
- 42 Waverly St Unit 3
- 50 Leo M Birmingham Pkwy Unit 605
- 50 Leo M Birmingham Pkwy Unit 303
- 50 Leo M Birmingham Pkwy Unit 603
- 50 Leo M Birmingham Pkwy Unit 501
- 70 Leo Birmingham Pkwy Unit 307
- 100 Lincoln St Unit 302
- 100 Lincoln St Unit 507
- 100 Lincoln St Unit 306
- 100 Lincoln St Unit 201
- 100 Lincoln St Unit 303
- 110-112 Litchfield St
- 408 Western Ave
- 472-474 Western Ave
- 151 Coolidge Ave Unit 105
- 199 Coolidge Ave Unit 401
- 131 Coolidge Ave Unit 123
- 180 Telford St Unit 5-9
- 27 Waverly St
- 27 Waverly St Unit 2
- 27 Waverly St Unit 1
- 29 Waverly St
- 29 Waverly St Unit 2
- 29 Waverly St Unit 3
- 10 Portsmouth St
- 10 Portsmouth St
- 10 Portsmouth St Unit 1
- 31 Waverly St
- 26 Waverly St Unit 409
- 26 Waverly St Unit 408
- 26 Waverly St Unit 407
- 26 Waverly St Unit 406
- 26 Waverly St Unit 405
- 26 Waverly St Unit 404
- 26 Waverly St Unit 403
- 26 Waverly St Unit 402
- 26 Waverly St Unit 401
- 26 Waverly St Unit 310