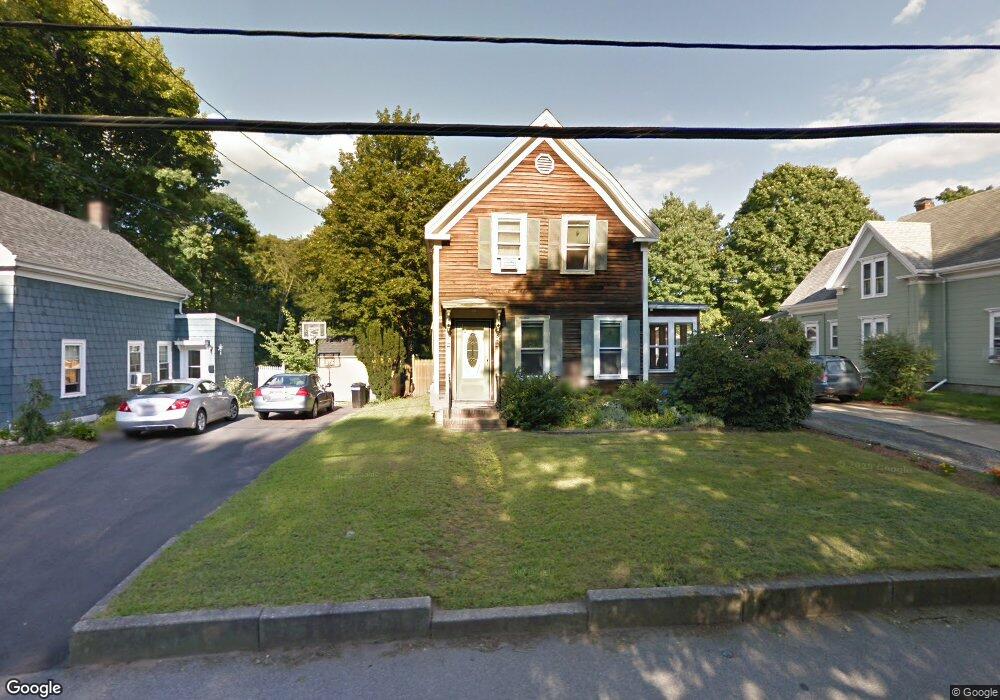
27 Webb St Weymouth, MA 02188
Weymouth Landing NeighborhoodEstimated Value: $519,000 - $627,000
2
Beds
3
Baths
1,497
Sq Ft
$395/Sq Ft
Est. Value
About This Home
This home is located at 27 Webb St, Weymouth, MA 02188 and is currently estimated at $590,810, approximately $394 per square foot. 27 Webb St is a home located in Norfolk County with nearby schools including Frederick C Murphy, Abigail Adams Middle School, and Weymouth Middle School Chapman.
Ownership History
Date
Name
Owned For
Owner Type
Purchase Details
Closed on
Dec 18, 1992
Sold by
Hurney Extr Michael E
Bought by
Hoffman Paul F and Hoffman Donna M
Current Estimated Value
Home Financials for this Owner
Home Financials are based on the most recent Mortgage that was taken out on this home.
Original Mortgage
$82,600
Interest Rate
8.3%
Mortgage Type
Purchase Money Mortgage
Create a Home Valuation Report for This Property
The Home Valuation Report is an in-depth analysis detailing your home's value as well as a comparison with similar homes in the area
Home Values in the Area
Average Home Value in this Area
Purchase History
| Date | Buyer | Sale Price | Title Company |
|---|---|---|---|
| Hoffman Paul F | $87,000 | -- |
Source: Public Records
Mortgage History
| Date | Status | Borrower | Loan Amount |
|---|---|---|---|
| Closed | Hoffman Paul F | $82,600 |
Source: Public Records
Tax History Compared to Growth
Tax History
| Year | Tax Paid | Tax Assessment Tax Assessment Total Assessment is a certain percentage of the fair market value that is determined by local assessors to be the total taxable value of land and additions on the property. | Land | Improvement |
|---|---|---|---|---|
| 2025 | $5,181 | $513,000 | $223,200 | $289,800 |
| 2024 | $5,023 | $489,100 | $212,600 | $276,500 |
| 2023 | $4,844 | $463,500 | $196,900 | $266,600 |
| 2022 | $4,735 | $413,200 | $182,300 | $230,900 |
| 2021 | $4,381 | $373,200 | $182,300 | $190,900 |
| 2020 | $4,191 | $351,600 | $182,300 | $169,300 |
| 2019 | $4,093 | $337,700 | $175,300 | $162,400 |
| 2018 | $3,974 | $317,900 | $166,900 | $151,000 |
| 2017 | $3,651 | $285,000 | $159,000 | $126,000 |
| 2016 | $3,510 | $274,200 | $152,900 | $121,300 |
| 2015 | $3,310 | $256,600 | $146,000 | $110,600 |
| 2014 | $3,172 | $238,500 | $135,800 | $102,700 |
Source: Public Records
Map
Nearby Homes
- 114 Broad St Unit D
- 114 Broad St Unit C
- 19 Vine St Unit 3
- 19 Vine St Unit 1
- 11 Richmond St
- 23-25 Lindbergh Ave
- 122 Washington St Unit 22
- 16 Lindbergh Ave
- 286 Broad St
- 294 Commercial St
- 12 Klasson Ln
- 76 Kingman St
- 36 Brookside Rd
- 33 Congress St
- 15 Summer St
- 367 Essex St
- 286 Essex St
- 15 1st St
- 38 Idlewell St
- 37 Lantern Ln