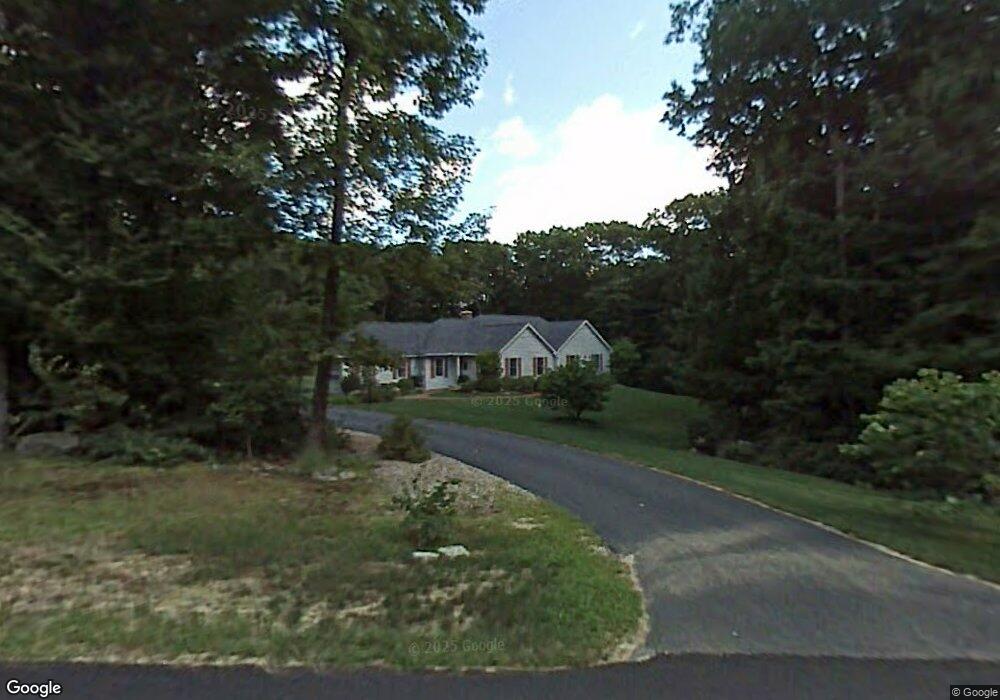
27 Westview Rd Brookline, NH 03033
Estimated Value: $690,000 - $738,000
3
Beds
2
Baths
3,009
Sq Ft
$235/Sq Ft
Est. Value
About This Home
This home is located at 27 Westview Rd, Brookline, NH 03033 and is currently estimated at $706,992, approximately $234 per square foot. 27 Westview Rd is a home with nearby schools including Richard Maghakian Memorial School, Captain Samuel Douglass Academy, and Hollis-Brookline Middle School.
Ownership History
Date
Name
Owned For
Owner Type
Purchase Details
Closed on
Aug 25, 1997
Sold by
Glendale Homes Inc
Bought by
Thomas Joseph M and Thomas Veronika V
Current Estimated Value
Home Financials for this Owner
Home Financials are based on the most recent Mortgage that was taken out on this home.
Original Mortgage
$50,000
Outstanding Balance
$7,715
Interest Rate
7.42%
Estimated Equity
$699,277
Create a Home Valuation Report for This Property
The Home Valuation Report is an in-depth analysis detailing your home's value as well as a comparison with similar homes in the area
Home Values in the Area
Average Home Value in this Area
Purchase History
| Date | Buyer | Sale Price | Title Company |
|---|---|---|---|
| Thomas Joseph M | $236,600 | -- |
Source: Public Records
Mortgage History
| Date | Status | Borrower | Loan Amount |
|---|---|---|---|
| Open | Thomas Joseph M | $50,000 |
Source: Public Records
Tax History Compared to Growth
Tax History
| Year | Tax Paid | Tax Assessment Tax Assessment Total Assessment is a certain percentage of the fair market value that is determined by local assessors to be the total taxable value of land and additions on the property. | Land | Improvement |
|---|---|---|---|---|
| 2024 | $14,606 | $646,000 | $209,400 | $436,600 |
| 2023 | $13,424 | $646,000 | $209,400 | $436,600 |
| 2022 | $11,638 | $391,600 | $126,100 | $265,500 |
| 2021 | $11,192 | $391,600 | $126,100 | $265,500 |
| 2020 | $10,886 | $391,600 | $126,100 | $265,500 |
| 2019 | $11,697 | $391,600 | $126,100 | $265,500 |
| 2018 | $11,576 | $391,600 | $126,100 | $265,500 |
| 2017 | $10,129 | $307,500 | $105,100 | $202,400 |
| 2016 | $10,012 | $307,500 | $105,100 | $202,400 |
| 2015 | $9,548 | $307,500 | $105,100 | $202,400 |
| 2014 | $10,101 | $307,500 | $105,100 | $202,400 |
| 2013 | $9,726 | $307,500 | $105,100 | $202,400 |
Source: Public Records
Map
Nearby Homes
- 8 Colburn Rd
- 93 Old Milford Rd
- 2 Ninth St
- 303 Route 13
- 172 Hayden Rd
- 5 Carons Way
- 28A Rocky Pond Rd
- 167 Route 13
- 36 Berkeley Place
- 686 Route 13 S
- 00 Ruonala Rd
- 22 Hobart Hill Rd
- 3 Wood Ln
- 4-13 Woodmont Dr
- 102 Silver Lake Rd
- 131 Badger Hill Dr
- 77 Mooar Hill Rd
- 22 Austin Ln
- 104 N Mason Rd
- 26 Melendy Rd Unit 97