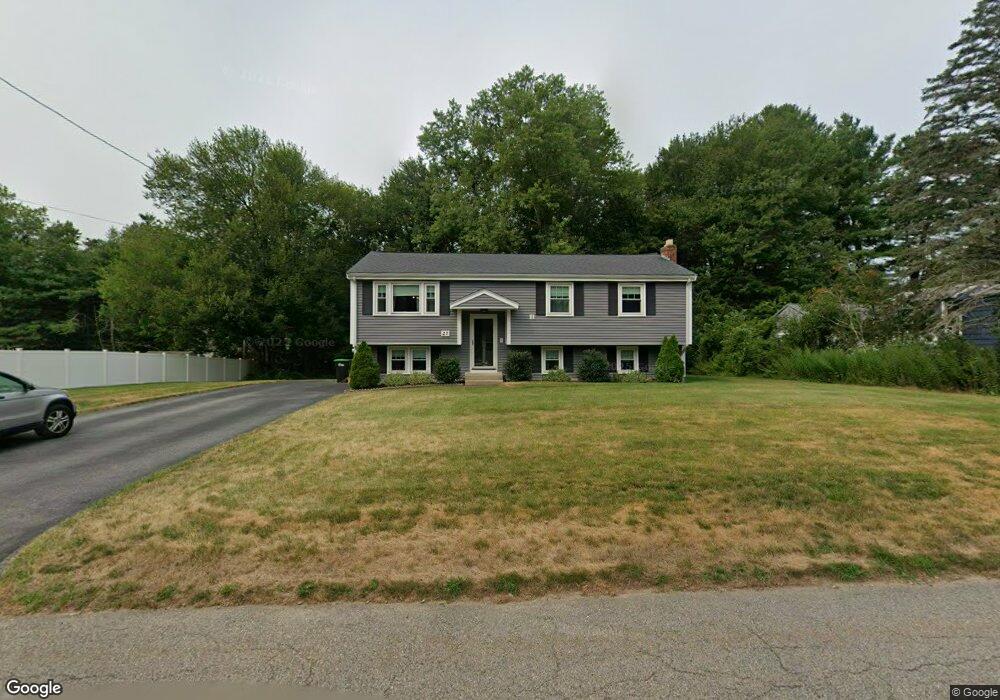
27 Wilbur St Norton, MA 02766
Estimated Value: $567,725 - $641,000
3
Beds
2
Baths
1,248
Sq Ft
$477/Sq Ft
Est. Value
About This Home
This home is located at 27 Wilbur St, Norton, MA 02766 and is currently estimated at $594,681, approximately $476 per square foot. 27 Wilbur St is a home located in Bristol County with nearby schools including L.G. Nourse Elementary School, Henri A. Yelle Elementary School, and Norton Middle School.
Ownership History
Date
Name
Owned For
Owner Type
Purchase Details
Closed on
Mar 19, 2009
Sold by
Devine Margaret E
Bought by
Devine Christie M and Devine Hayley A
Current Estimated Value
Purchase Details
Closed on
Nov 24, 2008
Sold by
Devine Stephen P
Bought by
Devine Margaret E
Create a Home Valuation Report for This Property
The Home Valuation Report is an in-depth analysis detailing your home's value as well as a comparison with similar homes in the area
Home Values in the Area
Average Home Value in this Area
Purchase History
| Date | Buyer | Sale Price | Title Company |
|---|---|---|---|
| Devine Christie M | -- | -- | |
| Devine Margaret E | -- | -- |
Source: Public Records
Tax History Compared to Growth
Tax History
| Year | Tax Paid | Tax Assessment Tax Assessment Total Assessment is a certain percentage of the fair market value that is determined by local assessors to be the total taxable value of land and additions on the property. | Land | Improvement |
|---|---|---|---|---|
| 2025 | $61 | $469,200 | $181,200 | $288,000 |
| 2024 | $5,838 | $450,800 | $172,600 | $278,200 |
| 2023 | $5,526 | $425,400 | $162,800 | $262,600 |
| 2022 | $5,393 | $378,200 | $148,000 | $230,200 |
| 2021 | $5,102 | $341,700 | $140,900 | $200,800 |
| 2020 | $4,912 | $331,900 | $136,800 | $195,100 |
| 2019 | $4,225 | $314,800 | $131,600 | $183,200 |
| 2018 | $4,550 | $300,100 | $131,600 | $168,500 |
| 2017 | $9,347 | $280,600 | $131,600 | $149,000 |
| 2016 | $4,202 | $269,200 | $131,600 | $137,600 |
| 2015 | $4,054 | $263,400 | $129,000 | $134,400 |
| 2014 | $3,809 | $247,800 | $122,900 | $124,900 |
Source: Public Records
Map
Nearby Homes
- 6 Horton Dr
- 48 Codding Rd Unit 48
- 31 Owen Rd
- 0 Knollwood & 0 Rear Kensington
- 12 Kayak Trail
- 195 E Main St
- 0 Kensington Rd
- 14 Downing Dr
- 0 S Washington St Unit 73437419
- O Leonard St
- 8 Johnson Dr
- 1 Carlton Dr
- 15 S Washington St
- 23 Indian Rd
- 38 S Washington St
- 12 Sylvan Rd
- 10 Ridge Rd
- 0 Brook Pkwy
- 268 Reservoir St
- 15 Patten Rd