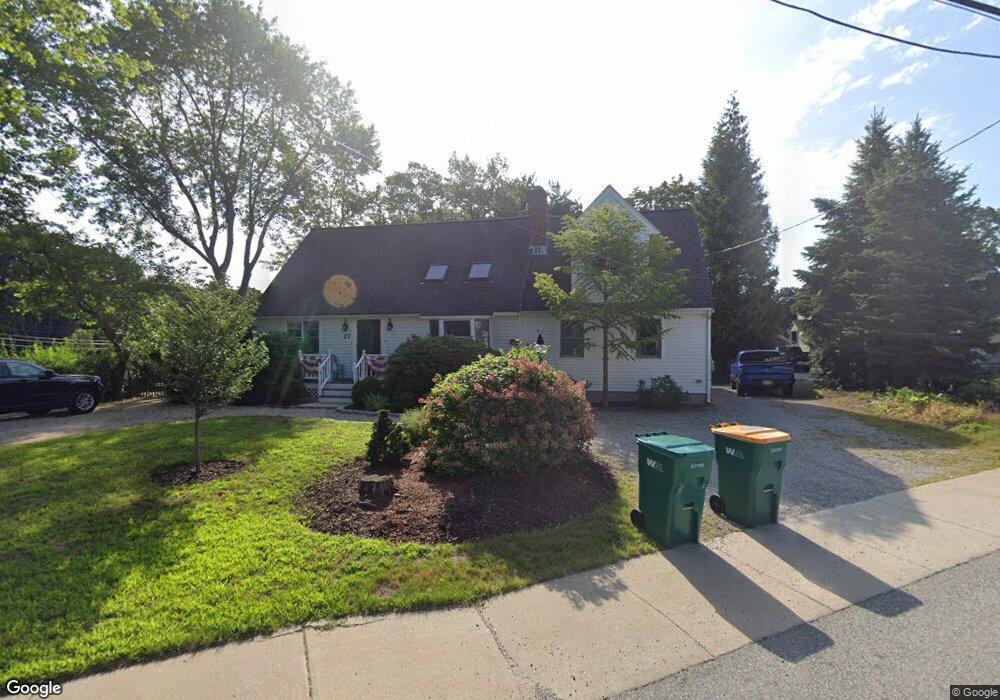
27 Winter St Woburn, MA 01801
North Woburn NeighborhoodEstimated Value: $972,000 - $1,227,000
5
Beds
3
Baths
2,600
Sq Ft
$417/Sq Ft
Est. Value
About This Home
This home is located at 27 Winter St, Woburn, MA 01801 and is currently estimated at $1,083,582, approximately $416 per square foot. 27 Winter St is a home located in Middlesex County with nearby schools including Mary D. Altavesta Elementary School, John F. Kennedy Middle School, and Woburn High School.
Ownership History
Date
Name
Owned For
Owner Type
Purchase Details
Closed on
Jun 4, 2019
Sold by
Angelo Robert and Angelo Patricia A
Bought by
Angelo Robert and Angelo Patricia A
Current Estimated Value
Create a Home Valuation Report for This Property
The Home Valuation Report is an in-depth analysis detailing your home's value as well as a comparison with similar homes in the area
Home Values in the Area
Average Home Value in this Area
Purchase History
| Date | Buyer | Sale Price | Title Company |
|---|---|---|---|
| Angelo Robert | -- | -- | |
| Angelo Robert | -- | -- |
Source: Public Records
Tax History Compared to Growth
Tax History
| Year | Tax Paid | Tax Assessment Tax Assessment Total Assessment is a certain percentage of the fair market value that is determined by local assessors to be the total taxable value of land and additions on the property. | Land | Improvement |
|---|---|---|---|---|
| 2025 | $7,857 | $920,000 | $340,400 | $579,600 |
| 2024 | $7,064 | $876,400 | $324,400 | $552,000 |
| 2023 | $6,931 | $796,700 | $295,000 | $501,700 |
| 2022 | $6,806 | $728,700 | $257,200 | $471,500 |
| 2021 | $9,939 | $686,500 | $245,200 | $441,300 |
| 2020 | $9,643 | $665,000 | $245,200 | $419,800 |
| 2019 | $9,021 | $649,100 | $233,800 | $415,300 |
| 2018 | $5,934 | $600,000 | $214,900 | $385,100 |
| 2017 | $5,518 | $555,100 | $205,000 | $350,100 |
| 2016 | $5,284 | $525,800 | $191,900 | $333,900 |
| 2015 | $5,150 | $506,400 | $179,700 | $326,700 |
| 2014 | $4,678 | $448,100 | $179,700 | $268,400 |
Source: Public Records
Map
Nearby Homes
- 6 Kendal Dr
- 23 Ward St Unit A
- 6R & 6 Tidd Ave
- 6 Tidd Ave
- 26 E Dexter Ave
- 16 Sunnyside Rd
- 28 Van Norden Rd
- 21 Spring Valley Rd
- 210 Winn St
- 38 Freeport Dr
- 20 Barbara Cir
- 82 Lowell St
- 104 Forest Park Rd
- 0 Johnson Rd
- 6 Callahan Dr
- 3 Highet Ave
- 4 Ardmore Ave
- 29 Grove Ln Unit 29
- 129 Cambridge St Unit 1
- 50 Hill Cir