
Seller's Agent in 2023
Tara Harbin
National Parks Realty - Bigfork
(406) 253-4115
30 in this area
60 Total Sales
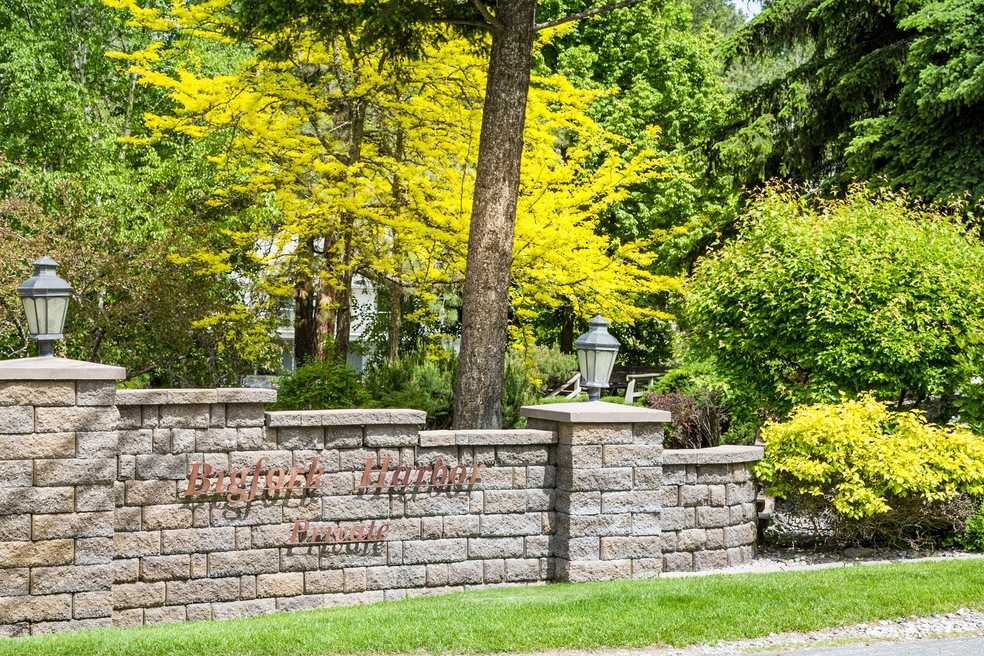

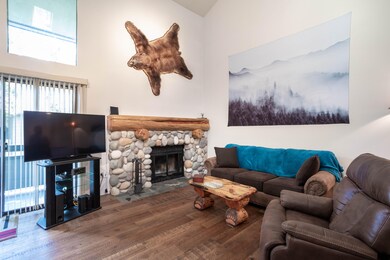
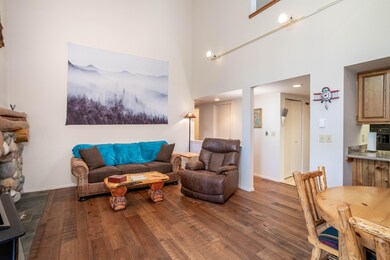
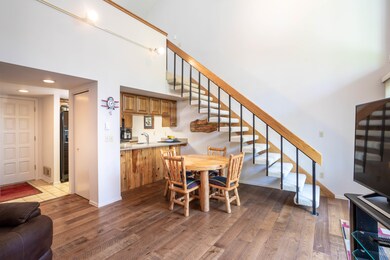
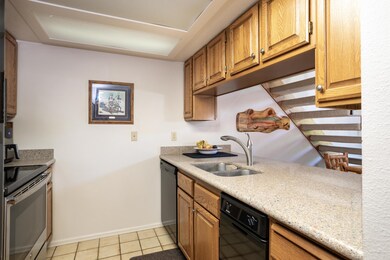
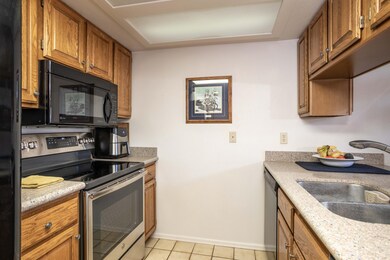
Remarks: Enjoy Bigfork in this great top floor remodeled condo walking distance from downtown. Featuring a dock on Bigfork Bay as well as a clubhouse complete with pool, hot tub, bayside fire pit, private boat ramp, fish-cleaning station, and beautifully landscaped grounds. This has everything to enjoy stress free living right on the Bay. This top floor condo features 2 bedrooms with 1.5 baths and a sizable loft with great storage. A short drive to golf at Eagle Bend, hiking in the Jewel Basin or Glacier National Park. This condo provides a fantastic getaway spot or year around living tight in Bigfork.
Last Agent to Sell the Property
Glacier Sotheby's International Realty Bigfork License #RRE-RBS-LIC-61981 Listed on: 08/15/2021
| Date | Type | Sale Price | Title Company |
|---|---|---|---|
| Warranty Deed | -- | Insured Titles | |
| Warranty Deed | -- | None Listed On Document | |
| Warranty Deed | -- | Fidelity National Title |
| Date | Event | Price | Change | Sq Ft Price |
|---|---|---|---|---|
| 10/30/2023 10/30/23 | Sold | -- | -- | -- |
| 09/29/2023 09/29/23 | For Sale | $399,000 | -38.5% | $504 / Sq Ft |
| 10/28/2022 10/28/22 | Sold | -- | -- | -- |
| 08/26/2022 08/26/22 | For Sale | $649,000 | +49.2% | $469 / Sq Ft |
| 08/05/2022 08/05/22 | Sold | -- | -- | -- |
| 06/15/2022 06/15/22 | Sold | -- | -- | -- |
| 06/08/2022 06/08/22 | For Sale | $435,000 | -40.0% | $549 / Sq Ft |
| 03/31/2022 03/31/22 | Sold | -- | -- | -- |
| 03/21/2022 03/21/22 | Price Changed | $725,000 | +48.3% | $533 / Sq Ft |
| 02/14/2022 02/14/22 | For Sale | $489,000 | -32.8% | $474 / Sq Ft |
| 01/24/2022 01/24/22 | Sold | -- | -- | -- |
| 12/27/2021 12/27/21 | For Sale | $728,000 | -2.9% | $599 / Sq Ft |
| 12/07/2021 12/07/21 | Sold | -- | -- | -- |
| 11/29/2021 11/29/21 | For Sale | $750,000 | +35.1% | $551 / Sq Ft |
| 11/05/2021 11/05/21 | Pending | -- | -- | -- |
| 11/01/2021 11/01/21 | For Sale | $555,000 | +15.9% | $383 / Sq Ft |
| 10/14/2021 10/14/21 | Sold | -- | -- | -- |
| 09/27/2021 09/27/21 | Sold | -- | -- | -- |
| 09/08/2021 09/08/21 | For Sale | $479,000 | +0.8% | $464 / Sq Ft |
| 09/08/2021 09/08/21 | Pending | -- | -- | -- |
| 08/31/2021 08/31/21 | Price Changed | $475,000 | -0.8% | $388 / Sq Ft |
| 08/31/2021 08/31/21 | For Sale | $479,000 | -3.2% | $464 / Sq Ft |
| 08/10/2021 08/10/21 | Sold | -- | -- | -- |
| 08/09/2021 08/09/21 | For Sale | $495,000 | +6.5% | $405 / Sq Ft |
| 07/12/2021 07/12/21 | For Sale | $465,000 | -15.4% | $451 / Sq Ft |
| 06/15/2021 06/15/21 | Sold | -- | -- | -- |
| 05/23/2021 05/23/21 | Pending | -- | -- | -- |
| 05/21/2021 05/21/21 | For Sale | $549,500 | +9.9% | $390 / Sq Ft |
| 11/23/2020 11/23/20 | Sold | -- | -- | -- |
| 09/28/2020 09/28/20 | For Sale | $500,000 | +68.0% | $412 / Sq Ft |
| 08/07/2020 08/07/20 | Sold | -- | -- | -- |
| 08/04/2020 08/04/20 | Sold | -- | -- | -- |
| 06/27/2020 06/27/20 | For Sale | $297,550 | -14.7% | $241 / Sq Ft |
| 02/04/2020 02/04/20 | Sold | -- | -- | -- |
| 02/04/2020 02/04/20 | Sold | -- | -- | -- |
| 12/31/2019 12/31/19 | Price Changed | $349,000 | -2.8% | $264 / Sq Ft |
| 11/12/2019 11/12/19 | For Sale | $359,000 | -34.6% | $272 / Sq Ft |
| 06/23/2019 06/23/19 | For Sale | $548,650 | +174.5% | $291 / Sq Ft |
| 06/18/2019 06/18/19 | Sold | -- | -- | -- |
| 04/04/2019 04/04/19 | Price Changed | $199,900 | -4.8% | $256 / Sq Ft |
| 01/28/2019 01/28/19 | For Sale | $210,000 | -38.1% | $269 / Sq Ft |
| 11/30/2018 11/30/18 | Sold | -- | -- | -- |
| 09/30/2018 09/30/18 | Price Changed | $339,500 | -1.6% | $245 / Sq Ft |
| 08/26/2018 08/26/18 | For Sale | $345,000 | +38.6% | $249 / Sq Ft |
| 06/18/2018 06/18/18 | Sold | -- | -- | -- |
| 05/18/2018 05/18/18 | Pending | -- | -- | -- |
| 04/12/2018 04/12/18 | For Sale | $249,000 | -48.8% | $204 / Sq Ft |
| 12/07/2017 12/07/17 | Sold | -- | -- | -- |
| 10/25/2017 10/25/17 | For Sale | $486,500 | +95.0% | $270 / Sq Ft |
| 10/06/2017 10/06/17 | Price Changed | $249,500 | -3.9% | $180 / Sq Ft |
| 09/21/2017 09/21/17 | Sold | -- | -- | -- |
| 09/11/2017 09/11/17 | For Sale | $259,500 | +5.9% | $188 / Sq Ft |
| 01/05/2017 01/05/17 | Sold | -- | -- | -- |
| 12/28/2016 12/28/16 | Pending | -- | -- | -- |
| 12/12/2016 12/12/16 | Sold | -- | -- | -- |
| 11/22/2016 11/22/16 | For Sale | $245,000 | -1.6% | $222 / Sq Ft |
| 08/29/2016 08/29/16 | Price Changed | $249,000 | -43.3% | $176 / Sq Ft |
| 07/25/2016 07/25/16 | Sold | -- | -- | -- |
| 07/20/2016 07/20/16 | Price Changed | $439,500 | +69.7% | $265 / Sq Ft |
| 07/06/2016 07/06/16 | Sold | -- | -- | -- |
| 06/28/2016 06/28/16 | Price Changed | $259,000 | -47.1% | $183 / Sq Ft |
| 06/08/2016 06/08/16 | Price Changed | $489,990 | +190.8% | $272 / Sq Ft |
| 05/13/2016 05/13/16 | For Sale | $168,500 | -37.6% | $213 / Sq Ft |
| 04/14/2016 04/14/16 | For Sale | $270,000 | -46.0% | $191 / Sq Ft |
| 03/08/2016 03/08/16 | Price Changed | $499,990 | +11.2% | $278 / Sq Ft |
| 08/25/2015 08/25/15 | For Sale | $449,500 | -13.5% | $271 / Sq Ft |
| 08/11/2015 08/11/15 | Price Changed | $519,900 | -1.3% | $289 / Sq Ft |
| 07/10/2015 07/10/15 | Price Changed | $526,500 | -5.9% | $293 / Sq Ft |
| 06/11/2015 06/11/15 | Price Changed | $559,500 | +107.2% | $311 / Sq Ft |
| 05/04/2015 05/04/15 | Sold | -- | -- | -- |
| 05/04/2015 05/04/15 | Pending | -- | -- | -- |
| 05/04/2015 05/04/15 | For Sale | $270,000 | -52.6% | $191 / Sq Ft |
| 03/30/2015 03/30/15 | Price Changed | $569,500 | -5.1% | $316 / Sq Ft |
| 11/17/2014 11/17/14 | For Sale | $599,900 | +130.8% | $333 / Sq Ft |
| 04/30/2014 04/30/14 | Sold | -- | -- | -- |
| 03/23/2014 03/23/14 | Pending | -- | -- | -- |
| 11/27/2013 11/27/13 | Sold | -- | -- | -- |
| 10/03/2013 10/03/13 | Pending | -- | -- | -- |
| 09/13/2013 09/13/13 | For Sale | $259,900 | +62.4% | $193 / Sq Ft |
| 06/07/2013 06/07/13 | For Sale | $160,000 | +6.7% | $205 / Sq Ft |
| 03/29/2013 03/29/13 | Sold | -- | -- | -- |
| 02/19/2013 02/19/13 | Pending | -- | -- | -- |
| 12/31/2012 12/31/12 | Sold | -- | -- | -- |
| 12/28/2012 12/28/12 | Pending | -- | -- | -- |
| 08/03/2012 08/03/12 | Sold | -- | -- | -- |
| 07/25/2012 07/25/12 | Pending | -- | -- | -- |
| 07/18/2012 07/18/12 | For Sale | $149,900 | -24.7% | $189 / Sq Ft |
| 04/16/2012 04/16/12 | For Sale | $199,000 | -18.7% | $135 / Sq Ft |
| 02/29/2012 02/29/12 | Sold | -- | -- | -- |
| 02/16/2012 02/16/12 | Pending | -- | -- | -- |
| 09/02/2011 09/02/11 | For Sale | $244,900 | -8.6% | $177 / Sq Ft |
| 08/21/2010 08/21/10 | For Sale | $267,900 | -- | $280 / Sq Ft |
| Year | Tax Paid | Tax Assessment Tax Assessment Total Assessment is a certain percentage of the fair market value that is determined by local assessors to be the total taxable value of land and additions on the property. | Land | Improvement |
|---|---|---|---|---|
| 2025 | $1,369 | $422,900 | $0 | $0 |
| 2024 | $1,742 | $311,600 | $0 | $0 |
| 2023 | $2,333 | $311,600 | $0 | $0 |
| 2022 | $1,942 | $212,000 | $0 | $0 |
| 2021 | $1,790 | $227,200 | $0 | $0 |
| 2020 | $1,855 | $197,800 | $0 | $0 |
| 2019 | $1,810 | $197,800 | $0 | $0 |
| 2018 | $1,539 | $157,400 | $0 | $0 |
| 2017 | $1,507 | $157,400 | $0 | $0 |
| 2016 | $1,496 | $153,600 | $0 | $0 |
| 2015 | $1,375 | $153,600 | $0 | $0 |
| 2014 | $1,563 | $122,483 | $0 | $0 |
Seller's Agent in 2023
Tara Harbin
National Parks Realty - Bigfork
(406) 253-4115
30 in this area
60 Total Sales
M
Seller Co-Listing Agent in 2023
Mary Siloti
National Parks Realty - Bigfork
(406) 871-8249
9 in this area
13 Total Sales
Buyer's Agent in 2023
Bryon O'Reilly
Ideal Real Estate
(406) 314-7762
7 in this area
19 Total Sales
G
Seller's Agent in 2022
Gabriel Broughton
Berkshire Hathaway HomeServices - Bigfork
(406) 890-4601
14 in this area
29 Total Sales
L
Seller's Agent in 2022
Larry Strachota
Montana Real Estate Group
(406) 250-6401
14 in this area
16 Total Sales
Seller's Agent in 2022
Bill Leininger
Dean & Leininger, Inc
(406) 253-7333
74 in this area
135 Total Sales
Source: Montana Regional MLS
MLS Number: 22113026
APN: 07-3835-36-1-51-01-7201
Disclaimer: Certain information contained herein is derived from information provided by parties other than Homes.com. All information provided is deemed reliable, but is not guaranteed to be accurate and should be independently verified.
![]() IDX information is provided exclusively for personal, non-commercial use, and may not be used for any purpose other than to identify prospective properties consumers may be interested in purchasing. Information is deemed reliable but not guaranteed.
IDX information is provided exclusively for personal, non-commercial use, and may not be used for any purpose other than to identify prospective properties consumers may be interested in purchasing. Information is deemed reliable but not guaranteed.