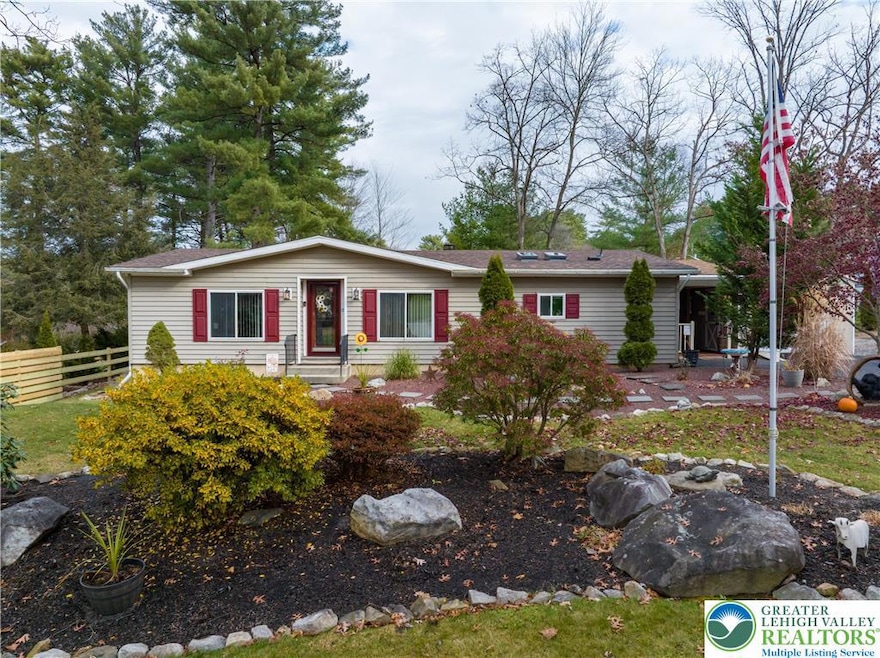
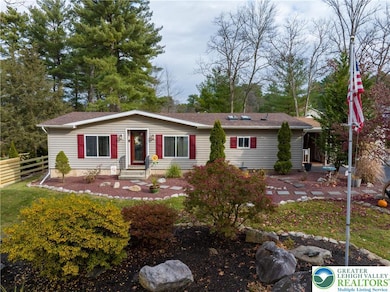
270 Craig St Palmerton, PA 18071
Estimated payment $1,799/month
Highlights
- Living Room with Fireplace
- Skylights
- Walk-In Closet
- Enclosed Patio or Porch
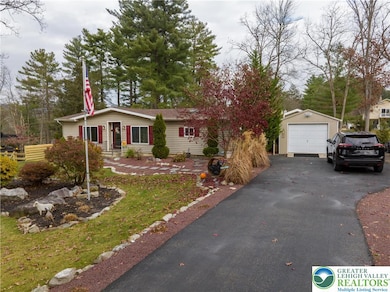
- 1 Car Attached Garage
- Shed
About This Home
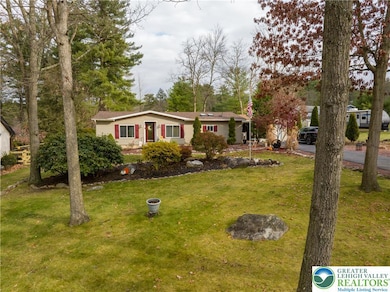
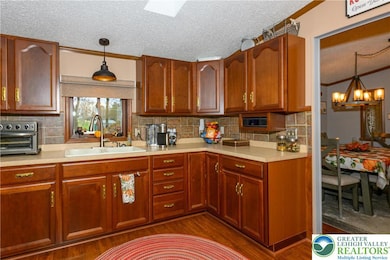
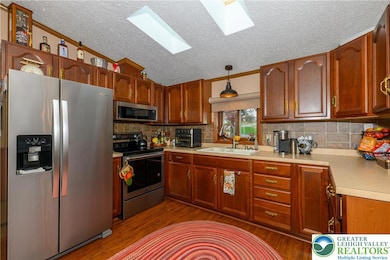
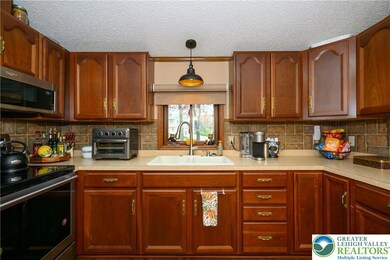
Ranch style home in complete move-in condition * 3 Bedrooms * 2 Full Baths * Open concept throughout * Cathedral ceilings * Gas fireplace in spacious living room * Skylites in kitchen * Master suite with master bath and walk in closet * Spare bedroom with walk in closet * Oversized windows bring in an abundance of light! * Heatpump with central air * Covered breezeway * Enclosed patio * Garage * New roof just installed * Nice back yard * Great neighborhood * Just move your furniture in!
Property Details
Home Type
- Mobile/Manufactured
Est. Annual Taxes
- $3,900
Year Built
- Built in 1988
Lot Details
- 0.36 Acre Lot
- Lot Dimensions are 91 x 193
Parking
- 1 Car Attached Garage
Home Design
- Vinyl Siding
Interior Spaces
- 1,344 Sq Ft Home
- 1-Story Property
- Skylights
- Living Room with Fireplace
- Laundry on main level
Bedrooms and Bathrooms
- 3 Bedrooms
- Walk-In Closet
- 2 Full Bathrooms
Outdoor Features
- Enclosed Patio or Porch
- Shed
Utilities
- Heating Available
Community Details
- Stone Ridge Manor Subdivision
Map
Home Values in the Area
Average Home Value in this Area
Tax History
| Year | Tax Paid | Tax Assessment Tax Assessment Total Assessment is a certain percentage of the fair market value that is determined by local assessors to be the total taxable value of land and additions on the property. | Land | Improvement |
|---|---|---|---|---|
| 2025 | $3,974 | $46,200 | $12,600 | $33,600 |
| 2024 | $3,715 | $46,200 | $12,600 | $33,600 |
| 2023 | $3,588 | $46,200 | $12,600 | $33,600 |
| 2022 | $3,419 | $46,200 | $12,600 | $33,600 |
| 2021 | $3,309 | $46,200 | $12,600 | $33,600 |
| 2020 | $3,263 | $46,200 | $12,600 | $33,600 |
| 2019 | $3,171 | $46,200 | $12,600 | $33,600 |
| 2018 | $3,171 | $46,200 | $12,600 | $33,600 |
| 2017 | $3,113 | $46,200 | $12,600 | $33,600 |
| 2016 | -- | $46,200 | $12,600 | $33,600 |
| 2015 | -- | $46,200 | $12,600 | $33,600 |
| 2014 | -- | $46,200 | $12,600 | $33,600 |
Property History
| Date | Event | Price | List to Sale | Price per Sq Ft |
|---|---|---|---|---|
| 12/01/2025 12/01/25 | Pending | -- | -- | -- |
| 11/25/2025 11/25/25 | For Sale | $279,900 | -- | $208 / Sq Ft |
Purchase History
| Date | Type | Sale Price | Title Company |
|---|---|---|---|
| Deed | $170,000 | Home Settlement Services | |
| Deed | $53,000 | None Available |
Mortgage History
| Date | Status | Loan Amount | Loan Type |
|---|---|---|---|
| Open | $70,040 | New Conventional |
Source: Greater Lehigh Valley REALTORS®
MLS Number: 768581
APN: 56A-31-A115
Disclaimer: Certain information contained herein is derived from information provided by parties other than Homes.com. All information provided is deemed reliable, but is not guaranteed to be accurate and should be independently verified.
![]() IDX information is provided exclusively for personal, non-commercial use, and may not be used for any purpose other than to identify prospective properties consumers may be interested in purchasing.
IDX information is provided exclusively for personal, non-commercial use, and may not be used for any purpose other than to identify prospective properties consumers may be interested in purchasing.
Information is deemed reliable but not guaranteed.
- 601 Fireline Rd
- 211 Fireline Rd
- 714 Lincoln Ave
- 1104 Princeton Ave
- 873 Edgemont Ave
- 2317 E Lizard Creek Rd
- 122 Horseshoe Ln
- 313 E Fireline Rd
- 313 N Fireline Rd
- 253 Main St
- 253 Main St
- 758 Church St
- 113 Lehigh Ave
- 115 Lehigh Ave
- 44 Apache
- 1212 3rd St
- 600 N Harrity Rd
- 321 Lehigh Ave
- 441 Franklin Ave
- 422 Lehigh Ave
