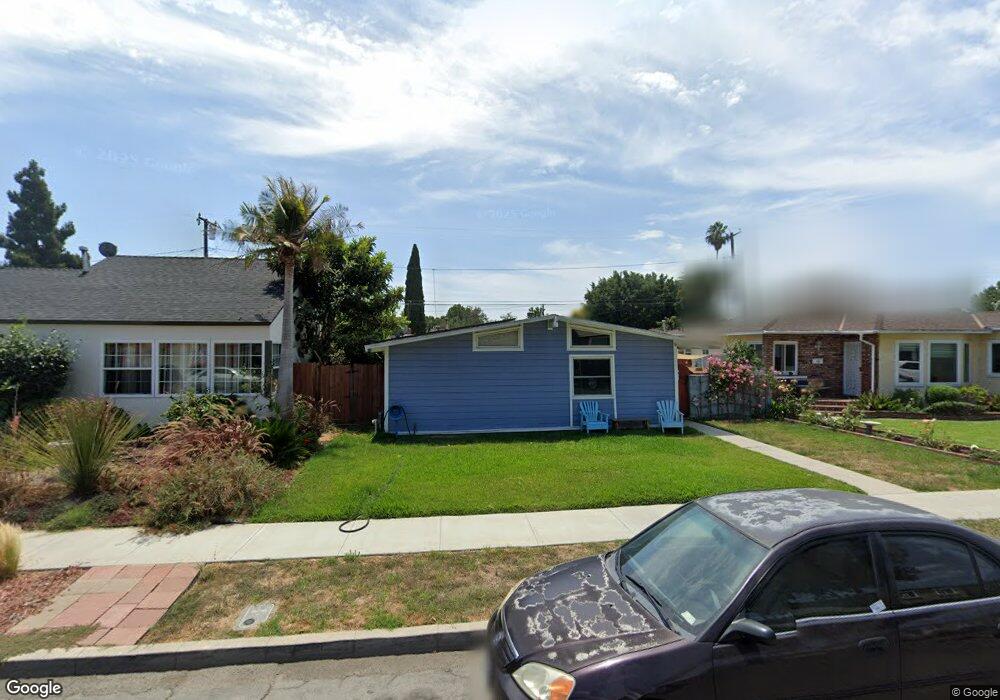
270 E 65th St Unit 1 Long Beach, CA 90805
Coolidge Triangle NeighborhoodEstimated Value: $679,000 - $730,000
4
Beds
2
Baths
1,134
Sq Ft
$620/Sq Ft
Est. Value
About This Home
This home is located at 270 E 65th St Unit 1, Long Beach, CA 90805 and is currently estimated at $703,223, approximately $620 per square foot. 270 E 65th St Unit 1 is a home located in Los Angeles County with nearby schools including Colin Powell Academy for Success, Jordan High School, and Gethsemane Baptist Christian School.
Ownership History
Date
Name
Owned For
Owner Type
Purchase Details
Closed on
Oct 11, 2011
Sold by
Moroso Philip J and Moroso Lisa A
Bought by
Pulido Osvaldo and Pulido Blanca
Current Estimated Value
Home Financials for this Owner
Home Financials are based on the most recent Mortgage that was taken out on this home.
Original Mortgage
$238,789
Outstanding Balance
$164,611
Interest Rate
4.4%
Mortgage Type
FHA
Estimated Equity
$538,612
Purchase Details
Closed on
Jul 24, 2003
Sold by
Moroso Philip J
Bought by
Moroso Philip J and Moroso Lisa A
Purchase Details
Closed on
Nov 8, 2000
Sold by
Moroso Robert A and Moroso Philip J
Bought by
Moroso Philip J
Create a Home Valuation Report for This Property
The Home Valuation Report is an in-depth analysis detailing your home's value as well as a comparison with similar homes in the area
Home Values in the Area
Average Home Value in this Area
Purchase History
| Date | Buyer | Sale Price | Title Company |
|---|---|---|---|
| Pulido Osvaldo | $245,000 | Ortc | |
| Moroso Philip J | -- | Stewart Title | |
| Moroso Philip J | -- | -- |
Source: Public Records
Mortgage History
| Date | Status | Borrower | Loan Amount |
|---|---|---|---|
| Open | Pulido Osvaldo | $238,789 |
Source: Public Records
Tax History
| Year | Tax Paid | Tax Assessment Tax Assessment Total Assessment is a certain percentage of the fair market value that is determined by local assessors to be the total taxable value of land and additions on the property. | Land | Improvement |
|---|---|---|---|---|
| 2025 | $4,336 | $307,720 | $166,420 | $141,300 |
| 2024 | $4,154 | $301,687 | $163,157 | $138,530 |
| 2023 | $4,084 | $295,772 | $159,958 | $135,814 |
| 2022 | $3,841 | $289,973 | $156,822 | $133,151 |
| 2021 | $3,762 | $284,289 | $153,748 | $130,541 |
| 2019 | $3,709 | $275,859 | $149,189 | $126,670 |
| 2018 | $3,546 | $270,451 | $146,264 | $124,187 |
| 2016 | $3,264 | $259,951 | $140,586 | $119,365 |
| 2015 | $3,136 | $256,048 | $138,475 | $117,573 |
| 2014 | $3,118 | $251,033 | $135,763 | $115,270 |
Source: Public Records
Map
Nearby Homes
- 274 E 65th St
- 275 E Artesia Blvd
- 223 E Marker St
- 180 E 67th St
- 270 E Heath Ln
- 247 E 67th Way
- 289 E Heath Ln
- 110 W Forhan St
- 155 E Barclay St
- 200 E Barclay St
- 140 W Bort St
- 6665 Long Beach Blvd
- 6665 Long Beach Blvd Unit B23
- 6110 Long Beach Blvd
- 161 W Harcourt St
- 21 E 68th St
- 125 E 68th Way
- 6475 Atlantic Ave Unit 911
- 6475 Atlantic Ave Unit 815
- 350 E 69th Way
Your Personal Tour Guide
Ask me questions while you tour the home.