270 Knoxbury Ct Gurnee, IL 60031
Estimated Value: $245,073 - $258,000
3
Beds
2
Baths
1,408
Sq Ft
$178/Sq Ft
Est. Value
About This Home
This home is located at 270 Knoxbury Ct, Gurnee, IL 60031 and is currently estimated at $250,018, approximately $177 per square foot. 270 Knoxbury Ct is a home located in Lake County with nearby schools including Spaulding Elementary School, Viking Middle School, and Warren Township High School.
Ownership History
Date
Name
Owned For
Owner Type
Purchase Details
Closed on
Apr 17, 2000
Sold by
Cybator Gina Ann
Bought by
Johnson Donna
Current Estimated Value
Home Financials for this Owner
Home Financials are based on the most recent Mortgage that was taken out on this home.
Original Mortgage
$107,500
Outstanding Balance
$36,856
Interest Rate
8.24%
Estimated Equity
$213,162
Purchase Details
Closed on
Mar 25, 1997
Sold by
The Chicago Trust Company
Bought by
Cybator Gina Ann
Home Financials for this Owner
Home Financials are based on the most recent Mortgage that was taken out on this home.
Original Mortgage
$112,200
Interest Rate
7.73%
Mortgage Type
VA
Purchase Details
Closed on
Jul 7, 1994
Sold by
Carris Dean and Carris Frank
Bought by
First State Bk & Tr Company Of Park Ridge
Purchase Details
Closed on
Sep 30, 1993
Sold by
Parrish Joyce J
Bought by
Carris Dean and Carris Frank
Create a Home Valuation Report for This Property
The Home Valuation Report is an in-depth analysis detailing your home's value as well as a comparison with similar homes in the area
Home Values in the Area
Average Home Value in this Area
Purchase History
| Date | Buyer | Sale Price | Title Company |
|---|---|---|---|
| Johnson Donna | $119,500 | -- | |
| Cybator Gina Ann | $115,000 | Attorneys Natl Title Network | |
| First State Bk & Tr Company Of Park Ridge | -- | -- | |
| Carris Dean | $77,333 | -- |
Source: Public Records
Mortgage History
| Date | Status | Borrower | Loan Amount |
|---|---|---|---|
| Open | Johnson Donna | $107,500 | |
| Previous Owner | Cybator Gina Ann | $112,200 |
Source: Public Records
Tax History Compared to Growth
Tax History
| Year | Tax Paid | Tax Assessment Tax Assessment Total Assessment is a certain percentage of the fair market value that is determined by local assessors to be the total taxable value of land and additions on the property. | Land | Improvement |
|---|---|---|---|---|
| 2024 | $4,043 | $63,210 | $8,227 | $54,983 |
| 2023 | $4,122 | $55,858 | $7,270 | $48,588 |
| 2022 | $4,122 | $52,020 | $7,271 | $44,749 |
| 2021 | $3,716 | $49,933 | $6,979 | $42,954 |
| 2020 | $3,583 | $48,705 | $6,807 | $41,898 |
| 2019 | $3,482 | $47,291 | $6,609 | $40,682 |
| 2018 | $2,906 | $43,743 | $4,331 | $39,412 |
| 2017 | $3,109 | $42,490 | $4,207 | $38,283 |
| 2016 | $3,484 | $40,598 | $4,020 | $36,578 |
| 2015 | $3,371 | $38,504 | $3,813 | $34,691 |
| 2014 | $3,281 | $38,696 | $3,740 | $34,956 |
| 2012 | $3,120 | $38,993 | $3,769 | $35,224 |
Source: Public Records
Map
Nearby Homes
- 93 Berkshire Ct Unit D
- 4471 Brighton Ct Unit 7
- 287 Kensington Ct Unit 4
- 3947 Blackstone Ave
- 450 Tanglewood Dr
- 4481 Country Trail Unit 1
- 424 Greenview Dr
- 3851 N Frontage Rd
- 00 Northwood Ave
- 0 Northwoods Ave Unit MRD11938775
- 662 Waterbury Ave
- 3910 Ingleside Ave
- 33564 Greenleaf St
- 4837 Middle Rd
- 3810 1st St
- 4437-4495 W Kennedy Dr
- 4506 W Forest Ave
- 963 Belle Plaine Ave
- 3503 Elaine Ave
- 3513 Barb Ave Unit 178
- 266 Knoxbury Ct Unit B
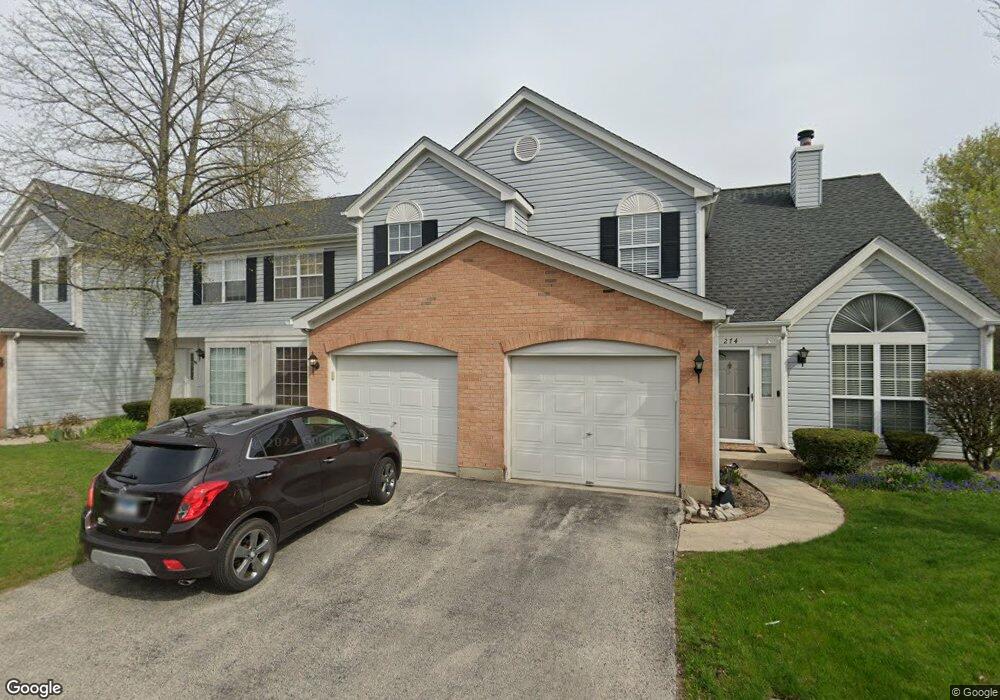
- 274 Knoxbury Ct Unit D
- 262 Knoxbury Ct Unit A
- 254 Wellington Cir Unit B
- 258 Wellington Cir Unit A
- 250 Wellington Cir Unit C
- 267 Knoxbury Ct Unit C
- 271 Knoxbury Ct Unit B
- 246 Wellington Cir Unit D
- 275 Knoxbury Ct Unit A
- 263 Knoxbury Ct Unit D
- 4327 Buckingham Dr Unit D
- 74 Lancaster Cir
- 72 Lancaster Cir Unit C
- 76 Lancaster Cir Unit A
- 70 Lancaster Cir Unit D
- 238 Wellington Cir Unit C
- 230 Wellington Cir Unit A
- 4331 Buckingham Dr
- 4330 Buckingham Dr Unit A