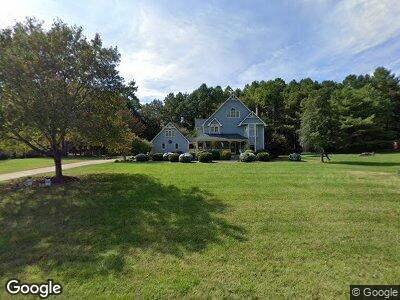
270 Partridge Run Unit 114-115 Salisbury, NC 28147
Estimated Value: $407,809 - $512,000
4
Beds
3
Baths
2,236
Sq Ft
$202/Sq Ft
Est. Value
About This Home
This home is located at 270 Partridge Run Unit 114-115, Salisbury, NC 28147 and is currently estimated at $450,702, approximately $201 per square foot. 270 Partridge Run Unit 114-115 is a home located in Rowan County with nearby schools including Hurley Elementary School, Southeast Middle School, and West Rowan High School.
Ownership History
Date
Name
Owned For
Owner Type
Purchase Details
Closed on
Jan 28, 2016
Sold by
Davidson Justin B and Davidson Kelsey
Bought by
Crupe Brittany
Current Estimated Value
Home Financials for this Owner
Home Financials are based on the most recent Mortgage that was taken out on this home.
Original Mortgage
$241,645
Outstanding Balance
$196,355
Interest Rate
3.98%
Mortgage Type
New Conventional
Estimated Equity
$227,783
Purchase Details
Closed on
Aug 20, 2014
Sold by
Bolick Leonard Homer and Bolick Rita Abee
Bought by
Davidson Justin B and Davidson Kelsey
Home Financials for this Owner
Home Financials are based on the most recent Mortgage that was taken out on this home.
Original Mortgage
$213,750
Interest Rate
4.19%
Mortgage Type
New Conventional
Create a Home Valuation Report for This Property
The Home Valuation Report is an in-depth analysis detailing your home's value as well as a comparison with similar homes in the area
Home Values in the Area
Average Home Value in this Area
Purchase History
| Date | Buyer | Sale Price | Title Company |
|---|---|---|---|
| Crupe Brittany | $238,000 | None Available | |
| Davidson Justin B | $225,000 | None Available |
Source: Public Records
Mortgage History
| Date | Status | Borrower | Loan Amount |
|---|---|---|---|
| Open | Crupe Brittany | $26,872 | |
| Open | Crupe Brittany | $241,645 | |
| Previous Owner | Davidson Justin B | $213,750 | |
| Previous Owner | Bolick Leonard Homer | $103,556 | |
| Previous Owner | Bolick Leonard Homer | $60,000 |
Source: Public Records
Tax History Compared to Growth
Tax History
| Year | Tax Paid | Tax Assessment Tax Assessment Total Assessment is a certain percentage of the fair market value that is determined by local assessors to be the total taxable value of land and additions on the property. | Land | Improvement |
|---|---|---|---|---|
| 2024 | $2,488 | $367,173 | $36,500 | $330,673 |
| 2023 | $2,488 | $367,173 | $36,500 | $330,673 |
| 2022 | $1,905 | $252,301 | $34,000 | $218,301 |
| 2021 | $1,886 | $252,301 | $34,000 | $218,301 |
| 2020 | $1,886 | $252,301 | $34,000 | $218,301 |
| 2019 | $1,886 | $252,301 | $34,000 | $218,301 |
| 2018 | $1,598 | $215,557 | $34,000 | $181,557 |
| 2017 | $1,598 | $215,557 | $34,000 | $181,557 |
| 2016 | $1,598 | $215,557 | $34,000 | $181,557 |
| 2015 | $1,617 | $215,557 | $34,000 | $181,557 |
| 2014 | $1,332 | $186,330 | $34,000 | $152,330 |
Source: Public Records
Map
Nearby Homes
- 335 Bob White Run
- 325 Bonaventure Dr
- 730 Harris Rd
- 315 Bonaventure Dr
- 102 Wyndham Way
- 275 Bonaventure Dr
- 280 Bonaventure Dr
- 209 Coventry Ln
- 104 Chalfont Ct
- 115 W Glenview Dr
- 274 Village Creek Way
- 104 Ardsley Way
- 414 E Glenview Dr
- 109 Windmill Rd
- 265 Prospect Trail
- 235 John Rainey Rd
- 330 Regency Rd
- 2885 Wright Ave
- 120 Southern Oaks Ln
- 1117 Shadowmoss Ct
- 270 Partridge Run
- 270 Partridge Run Unit 114-115
- 250 Partridge Run
- 550 Timberlane Trail
- 280 Partridge Run
- 280 Partridge Run Unit 116
- 275 Partridge Run
- 540 Timberlane Trail
- 265 Partridge Run
- 520 Timberlane Trail
- 560 Timberlane Trail
- 240 Partridge Run
- 530 Timberlane Trail
- 570 Timberlane Trail
- 245 Partridge Run
- 1045 Timberlane Cir
- 470 Quail Dr
- 1055 Timberlane Cir
- 1035 Timberlane Cir
- 565 Timberlane Trail