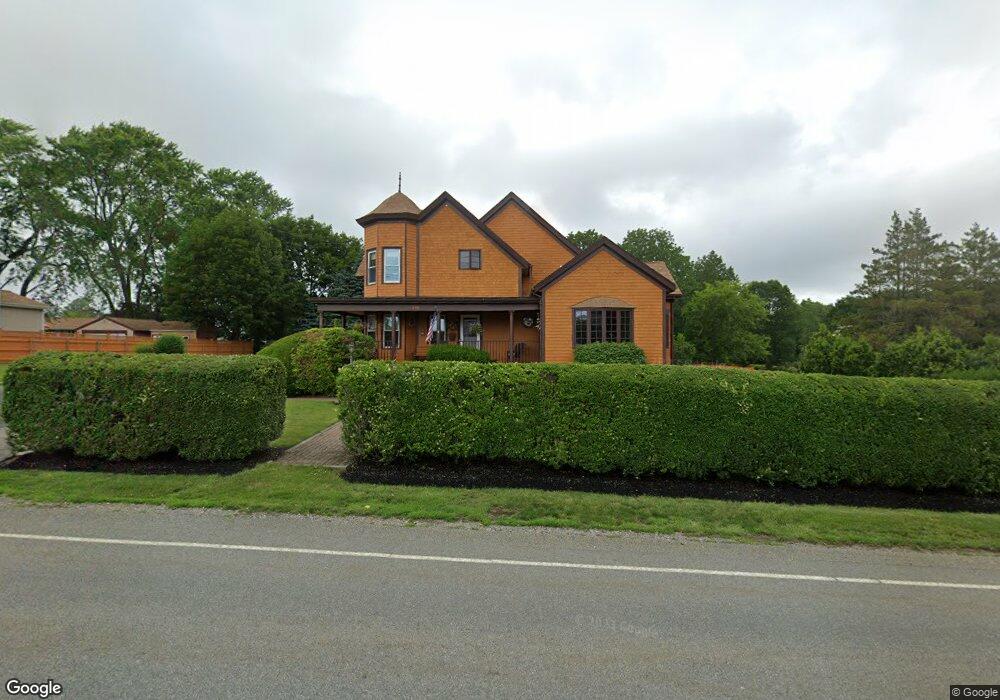
270 Read St Somerset, MA 02726
Brayton Point NeighborhoodEstimated Value: $607,000 - $717,000
4
Beds
3
Baths
2,712
Sq Ft
$249/Sq Ft
Est. Value
About This Home
This home is located at 270 Read St, Somerset, MA 02726 and is currently estimated at $675,267, approximately $248 per square foot. 270 Read St is a home located in Bristol County with nearby schools including Chace Street School, Somerset Middle School, and St. Michael's School.
Ownership History
Date
Name
Owned For
Owner Type
Purchase Details
Closed on
Feb 18, 2025
Sold by
Perry Adrien and Perry Mary E
Bought by
Perry Ft and Lindberg
Current Estimated Value
Purchase Details
Closed on
May 24, 1990
Sold by
Jolivet Marcellyne C
Bought by
Perry Adrien
Create a Home Valuation Report for This Property
The Home Valuation Report is an in-depth analysis detailing your home's value as well as a comparison with similar homes in the area
Home Values in the Area
Average Home Value in this Area
Purchase History
| Date | Buyer | Sale Price | Title Company |
|---|---|---|---|
| Perry Ft | -- | None Available | |
| Perry Ft | -- | None Available | |
| Perry Adrien | $195,000 | -- | |
| Perry Adrien | $195,000 | -- |
Source: Public Records
Mortgage History
| Date | Status | Borrower | Loan Amount |
|---|---|---|---|
| Previous Owner | Perry Adrien | $120,000 | |
| Previous Owner | Perry Adrien | $186,000 |
Source: Public Records
Tax History
| Year | Tax Paid | Tax Assessment Tax Assessment Total Assessment is a certain percentage of the fair market value that is determined by local assessors to be the total taxable value of land and additions on the property. | Land | Improvement |
|---|---|---|---|---|
| 2025 | $7,722 | $580,600 | $181,900 | $398,700 |
| 2024 | $6,936 | $542,300 | $181,900 | $360,400 |
| 2023 | $6,344 | $500,300 | $151,800 | $348,500 |
| 2022 | $5,899 | $443,900 | $132,200 | $311,700 |
| 2021 | $5,969 | $406,600 | $120,300 | $286,300 |
| 2020 | $5,826 | $382,800 | $120,300 | $262,500 |
| 2019 | $6,541 | $358,400 | $120,300 | $238,100 |
| 2018 | $5,702 | $336,200 | $119,300 | $216,900 |
| 2017 | $5,561 | $319,600 | $113,300 | $206,300 |
| 2016 | $5,596 | $319,600 | $113,300 | $206,300 |
| 2015 | $5,552 | $320,000 | $107,900 | $212,100 |
| 2014 | $7,438 | $308,000 | $107,900 | $200,100 |
Source: Public Records
Map
Nearby Homes
- 300 Read St
- 125 George St
- 34 Doherty Ave
- 1496 Riverside Ave
- 1174 Riverside Ave
- 1553 Riverside Ave
- 60 Aetna St
- 1022 Riverside Ave
- 35 Randall Ave
- 33 Hodges Ave
- 7 Bradley Ave
- 210 Harrison Ave
- 1706 Brayton Point Rd
- 33 Rhinecliffe Rd
- 197 Alberta Ave
- 82 Wellington St
- 46 Lilac Ave
- 36 Saint Mary St
- 0 Bark St Unit 1342599
- 0 Bark St Unit 73152576
Your Personal Tour Guide
Ask me questions while you tour the home.