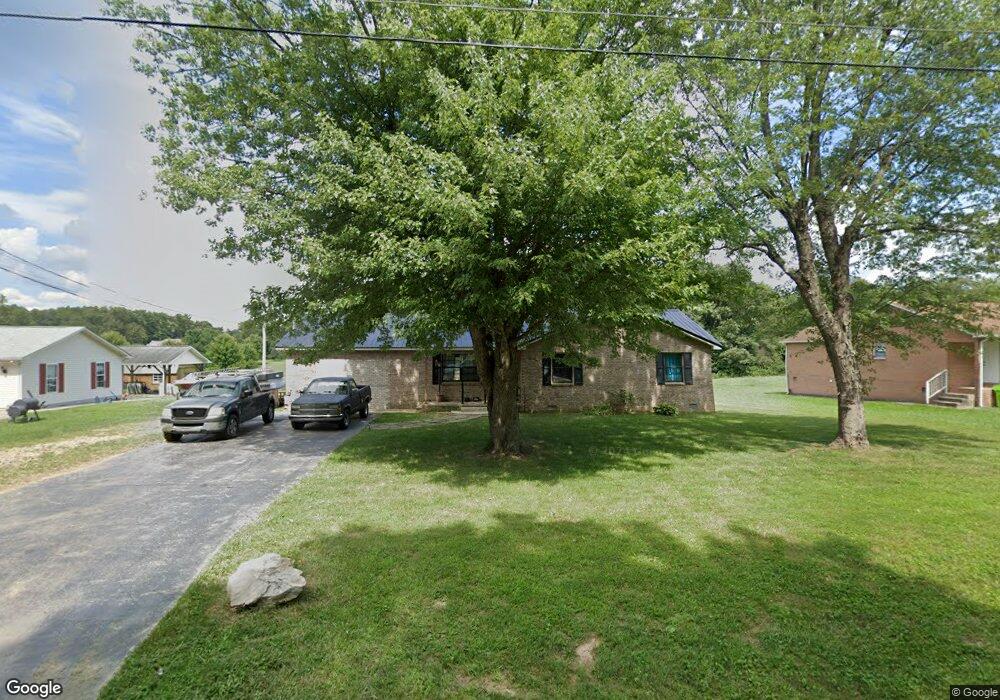
270 Short Rd Crossville, TN 38555
Estimated Value: $222,000 - $274,000
--
Bed
2
Baths
1,333
Sq Ft
$195/Sq Ft
Est. Value
About This Home
This home is located at 270 Short Rd, Crossville, TN 38555 and is currently estimated at $260,036, approximately $195 per square foot. 270 Short Rd is a home located in Cumberland County with nearby schools including Stone Elementary School, Stone Memorial High School, and Crossville Christian School.
Ownership History
Date
Name
Owned For
Owner Type
Purchase Details
Closed on
Oct 24, 2008
Sold by
Beaty Dwayne Lee
Bought by
Fuentes Francisco Antonio
Current Estimated Value
Purchase Details
Closed on
Oct 22, 2002
Sold by
Kilgore Ernest
Bought by
Beaty Dwayne Lee
Home Financials for this Owner
Home Financials are based on the most recent Mortgage that was taken out on this home.
Original Mortgage
$72,799
Interest Rate
6.01%
Purchase Details
Closed on
Feb 27, 2002
Sold by
Scarbrough Robert and Scarbrough Sandra
Bought by
Kilgore Ernest
Purchase Details
Closed on
Jan 12, 1989
Bought by
Scarbrough Robert G and Scarbrough Sandra J
Create a Home Valuation Report for This Property
The Home Valuation Report is an in-depth analysis detailing your home's value as well as a comparison with similar homes in the area
Home Values in the Area
Average Home Value in this Area
Purchase History
| Date | Buyer | Sale Price | Title Company |
|---|---|---|---|
| Fuentes Francisco Antonio | $100,000 | -- | |
| Beaty Dwayne Lee | $73,375 | -- | |
| Kilgore Ernest | $68,000 | -- | |
| Scarbrough Robert G | $21,000 | -- |
Source: Public Records
Mortgage History
| Date | Status | Borrower | Loan Amount |
|---|---|---|---|
| Previous Owner | Scarbrough Robert G | $72,799 |
Source: Public Records
Tax History Compared to Growth
Tax History
| Year | Tax Paid | Tax Assessment Tax Assessment Total Assessment is a certain percentage of the fair market value that is determined by local assessors to be the total taxable value of land and additions on the property. | Land | Improvement |
|---|---|---|---|---|
| 2024 | $464 | $40,925 | $3,650 | $37,275 |
| 2023 | $465 | $40,925 | $0 | $0 |
| 2022 | $465 | $40,925 | $3,650 | $37,275 |
| 2021 | $355 | $22,650 | $3,200 | $19,450 |
| 2020 | $355 | $22,650 | $3,200 | $19,450 |
| 2019 | $355 | $22,650 | $3,200 | $19,450 |
| 2018 | $355 | $22,650 | $3,200 | $19,450 |
| 2017 | $355 | $22,650 | $3,200 | $19,450 |
| 2016 | $339 | $22,200 | $3,200 | $19,000 |
| 2015 | $332 | $22,200 | $3,200 | $19,000 |
| 2014 | $332 | $22,184 | $0 | $0 |
Source: Public Records
Map
Nearby Homes