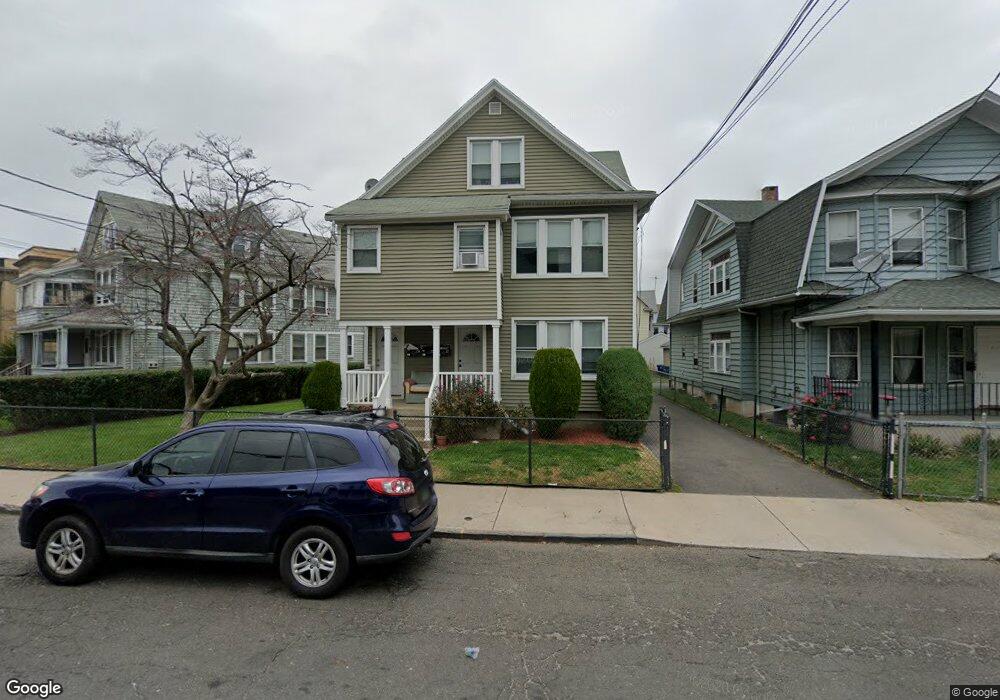
270 Wells St Unit 272 Bridgeport, CT 06606
Brooklawn-Saint Vincent NeighborhoodEstimated Value: $526,000 - $761,000
6
Beds
3
Baths
3,254
Sq Ft
$191/Sq Ft
Est. Value
About This Home
This home is located at 270 Wells St Unit 272, Bridgeport, CT 06606 and is currently estimated at $620,780, approximately $190 per square foot. 270 Wells St Unit 272 is a home located in Fairfield County with nearby schools including Read School, Central High School, and Catholic Academy of Bridgeport-St. Raphael Academy.
Ownership History
Date
Name
Owned For
Owner Type
Purchase Details
Closed on
Aug 24, 2005
Sold by
Bistolas Michael
Bought by
Mordecai Michael
Current Estimated Value
Home Financials for this Owner
Home Financials are based on the most recent Mortgage that was taken out on this home.
Original Mortgage
$292,000
Outstanding Balance
$153,589
Interest Rate
5.68%
Estimated Equity
$467,192
Purchase Details
Closed on
Jul 8, 2004
Sold by
Owen Lee Roy and Owen Veronica
Bought by
Bistocas Michael
Home Financials for this Owner
Home Financials are based on the most recent Mortgage that was taken out on this home.
Original Mortgage
$276,300
Interest Rate
6.32%
Purchase Details
Closed on
Feb 2, 2000
Sold by
Lavigne Rosaire and Lavigne Madeline
Bought by
Owen Lee Roy and Owen Veronica
Create a Home Valuation Report for This Property
The Home Valuation Report is an in-depth analysis detailing your home's value as well as a comparison with similar homes in the area
Home Values in the Area
Average Home Value in this Area
Purchase History
| Date | Buyer | Sale Price | Title Company |
|---|---|---|---|
| Mordecai Michael | $365,000 | -- | |
| Mordecai Michael | $365,000 | -- | |
| Bistocas Michael | $614,000 | -- | |
| Bistocas Michael | $614,000 | -- | |
| Owen Lee Roy | $147,000 | -- | |
| Owen Lee Roy | $147,000 | -- |
Source: Public Records
Mortgage History
| Date | Status | Borrower | Loan Amount |
|---|---|---|---|
| Open | Owen Lee Roy | $292,000 | |
| Closed | Owen Lee Roy | $292,000 | |
| Previous Owner | Owen Lee Roy | $276,300 |
Source: Public Records
Tax History Compared to Growth
Tax History
| Year | Tax Paid | Tax Assessment Tax Assessment Total Assessment is a certain percentage of the fair market value that is determined by local assessors to be the total taxable value of land and additions on the property. | Land | Improvement |
|---|---|---|---|---|
| 2025 | $9,700 | $223,250 | $71,250 | $152,000 |
| 2024 | $9,700 | $223,250 | $71,250 | $152,000 |
| 2023 | $9,700 | $223,250 | $71,250 | $152,000 |
| 2022 | $9,700 | $223,250 | $71,250 | $152,000 |
| 2021 | $9,700 | $223,250 | $71,250 | $152,000 |
| 2020 | $8,713 | $161,390 | $43,170 | $118,220 |
| 2019 | $8,713 | $161,390 | $43,170 | $118,220 |
| 2018 | $8,775 | $161,390 | $43,170 | $118,220 |
| 2017 | $8,775 | $161,390 | $43,170 | $118,220 |
| 2016 | $8,775 | $161,390 | $43,170 | $118,220 |
| 2015 | $7,937 | $188,070 | $43,540 | $144,530 |
| 2014 | $7,937 | $188,070 | $43,540 | $144,530 |
Source: Public Records
Map
Nearby Homes
- 76 Porter St
- 2395 Main St Unit 2397
- 90 Tom Thumb St
- 78 Fairmount Ave
- 390 Charles St Unit 106
- 330 French St
- 724 Capitol Ave Unit 726
- 31 Taft Ave
- 119 Madison Terrace
- 152 River St
- 178 Island Brook Ave
- 508 Hawley Ave
- 318 Center St
- 191 Oak St
- 936 Lindley St
- 604 William St
- 957 William St Unit A
- 106 Manhattan Ave Unit 108
- 39 Jane St
- 123 Harlem Ave