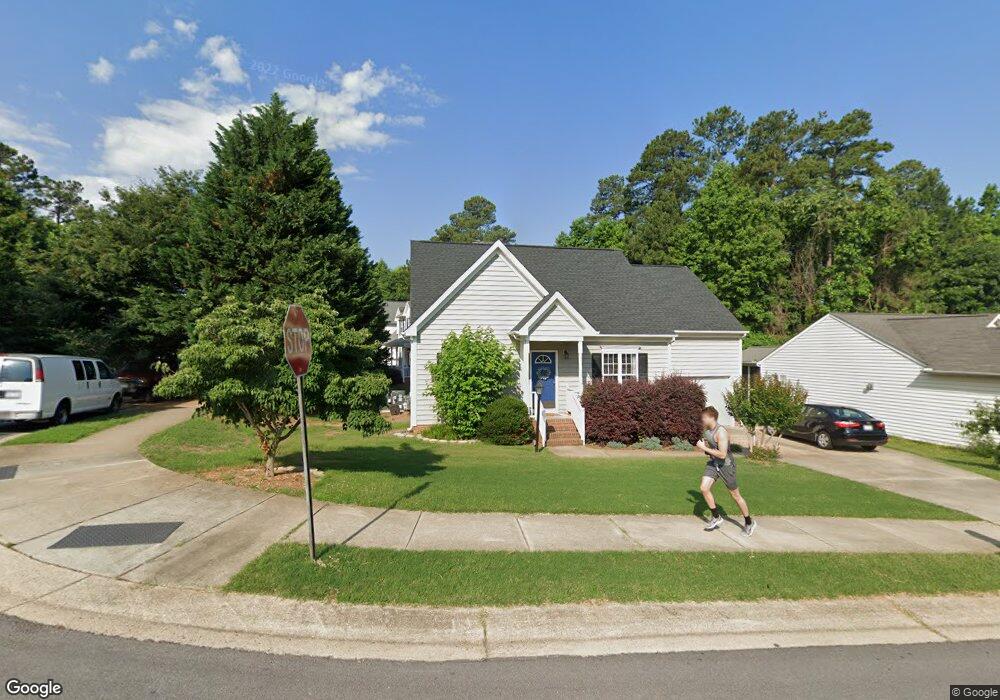
2700 Alder Ridge Ln Raleigh, NC 27603
Estimated Value: $401,000 - $434,000
--
Bed
3
Baths
1,625
Sq Ft
$256/Sq Ft
Est. Value
About This Home
This home is located at 2700 Alder Ridge Ln, Raleigh, NC 27603 and is currently estimated at $415,211, approximately $255 per square foot. 2700 Alder Ridge Ln is a home located in Wake County with nearby schools including Dillard Drive Magnet Elementary School, Dillard Drive Magnet Middle School, and Longleaf School Of The Arts.
Ownership History
Date
Name
Owned For
Owner Type
Purchase Details
Closed on
Oct 21, 2022
Sold by
Wang Rongjin and Wang Huimin
Bought by
Horizon Re Group Llc
Current Estimated Value
Purchase Details
Closed on
May 28, 2014
Sold by
Lang Brian and Lang Anna
Bought by
Wang Rongjin
Purchase Details
Closed on
Jun 30, 2006
Sold by
Lawrence David Lee and Lawrence Heather Martin
Bought by
Lang Brian
Home Financials for this Owner
Home Financials are based on the most recent Mortgage that was taken out on this home.
Original Mortgage
$152,800
Interest Rate
6.57%
Mortgage Type
Purchase Money Mortgage
Purchase Details
Closed on
Sep 27, 2002
Sold by
Murdock & Gannon Construction Inc
Bought by
Lawrence David Lee
Home Financials for this Owner
Home Financials are based on the most recent Mortgage that was taken out on this home.
Original Mortgage
$139,900
Interest Rate
5.5%
Create a Home Valuation Report for This Property
The Home Valuation Report is an in-depth analysis detailing your home's value as well as a comparison with similar homes in the area
Home Values in the Area
Average Home Value in this Area
Purchase History
| Date | Buyer | Sale Price | Title Company |
|---|---|---|---|
| Horizon Re Group Llc | -- | -- | |
| Wang Rongjin | $195,000 | None Available | |
| Lang Brian | $191,000 | None Available | |
| Lawrence David Lee | $156,000 | -- |
Source: Public Records
Mortgage History
| Date | Status | Borrower | Loan Amount |
|---|---|---|---|
| Previous Owner | Lang Brian | $152,800 | |
| Previous Owner | Lawrence David Lee | $139,900 |
Source: Public Records
Tax History Compared to Growth
Tax History
| Year | Tax Paid | Tax Assessment Tax Assessment Total Assessment is a certain percentage of the fair market value that is determined by local assessors to be the total taxable value of land and additions on the property. | Land | Improvement |
|---|---|---|---|---|
| 2025 | $3,625 | $413,379 | $160,000 | $253,379 |
| 2024 | $3,610 | $413,379 | $160,000 | $253,379 |
| 2023 | $3,021 | $275,327 | $60,000 | $215,327 |
| 2022 | $2,808 | $275,327 | $60,000 | $215,327 |
| 2021 | $2,699 | $275,327 | $60,000 | $215,327 |
| 2020 | $2,650 | $275,327 | $60,000 | $215,327 |
| 2019 | $2,338 | $200,007 | $54,000 | $146,007 |
| 2018 | $2,205 | $200,007 | $54,000 | $146,007 |
| 2017 | $2,101 | $200,007 | $54,000 | $146,007 |
| 2016 | $2,058 | $200,007 | $54,000 | $146,007 |
| 2015 | $2,025 | $193,599 | $48,000 | $145,599 |
| 2014 | $1,921 | $193,599 | $48,000 | $145,599 |
Source: Public Records
Map
Nearby Homes
- 2607 Sterling Park Dr
- 2636 Scattered Oak Ct
- 3113 Henslowe Dr
- 2816 Alder Ridge Ln
- 2901 Alder Ridge Ln
- 2271 Trailwood Valley Cir
- 2221 Mountain Mist Ct Unit 201
- 2220 Hoot Owl Ct
- 2505 Ferndown Ct
- 2528 Beech Gap Ct
- 2228 Trailwood Valley Cir
- 2524 Ferndown Ct
- 1901 Trailwood Heights Ln Unit 304
- 2208 Sierra Dr
- 2621 Ivory Run Way Unit 105
- 2108 Leadenhall Way
- 2801 Henslowe Dr
- 2831 Barrymore St Unit 107
- 2920 Barrymore St Unit 106
- 2028 Lost Ln
- 2508 Horizon Hike Ct
- 2504 Horizon Hike Ct
- L159 Horizon Hike Ct
- 2704 Alder Ridge Ln
- 2620 Alder Ridge Ln
- 2500 Horizon Hike Ct
- 2701 Alder Ridge Ln
- 2708 Alder Ridge Ln
- 2705 Alder Ridge Ln
- 2613 Buck Spring Ct
- 2621 Alder Ridge Ln
- 2701 Cassimir Ct
- 2700 Cassimir Ct
- 2709 Alder Ridge Ln
- 2616 Alder Ridge Ln
- 2617 Alder Ridge Ln
- 2609 Buck Spring Ct
- 2521 Farlow Gap Ln
- 2517 Farlow Gap Ln
- 2720 Upper Dry Falls Ct