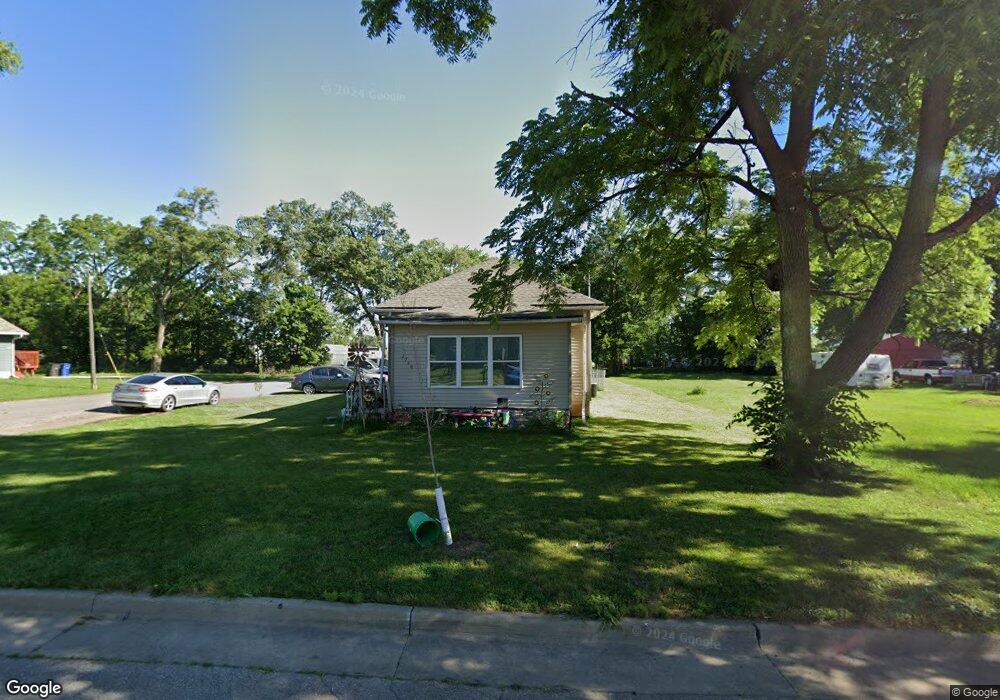
2700 E Elm St Des Moines, IA 50317
Chesterfield NeighborhoodEstimated Value: $86,835 - $170,000
2
Beds
1
Bath
872
Sq Ft
$154/Sq Ft
Est. Value
About This Home
This home is located at 2700 E Elm St, Des Moines, IA 50317 and is currently estimated at $134,709, approximately $154 per square foot. 2700 E Elm St is a home located in Polk County with nearby schools including Willard Elementary School, Hoyt Middle School, and East High School.
Ownership History
Date
Name
Owned For
Owner Type
Purchase Details
Closed on
Aug 13, 2012
Sold by
Russell Richard
Bought by
Rodgers Rikkia
Current Estimated Value
Purchase Details
Closed on
Jan 26, 2010
Sold by
Milosevic Lori L
Bought by
Knosp Dan
Purchase Details
Closed on
Apr 4, 2000
Sold by
Christensen William O
Bought by
Milosevic Lori L
Purchase Details
Closed on
Sep 1, 1998
Sold by
William O Christensen Revocable Trust
Bought by
Bland Harold L
Home Financials for this Owner
Home Financials are based on the most recent Mortgage that was taken out on this home.
Original Mortgage
$6,750
Interest Rate
10%
Mortgage Type
Seller Take Back
Create a Home Valuation Report for This Property
The Home Valuation Report is an in-depth analysis detailing your home's value as well as a comparison with similar homes in the area
Home Values in the Area
Average Home Value in this Area
Purchase History
| Date | Buyer | Sale Price | Title Company |
|---|---|---|---|
| Rodgers Rikkia | -- | None Available | |
| Knosp Dan | $1,602 | None Available | |
| Milosevic Lori L | $2,000 | -- | |
| Bland Harold L | $6,750 | -- |
Source: Public Records
Mortgage History
| Date | Status | Borrower | Loan Amount |
|---|---|---|---|
| Previous Owner | Bland Harold L | $6,750 |
Source: Public Records
Tax History Compared to Growth
Tax History
| Year | Tax Paid | Tax Assessment Tax Assessment Total Assessment is a certain percentage of the fair market value that is determined by local assessors to be the total taxable value of land and additions on the property. | Land | Improvement |
|---|---|---|---|---|
| 2025 | $322 | $18,900 | $10,600 | $8,300 |
| 2024 | $322 | $16,400 | $9,200 | $7,200 |
| 2023 | $330 | $16,400 | $9,200 | $7,200 |
| 2022 | $328 | $14,000 | $8,000 | $6,000 |
| 2021 | $310 | $14,000 | $8,000 | $6,000 |
| 2020 | $322 | $12,400 | $7,100 | $5,300 |
| 2019 | $284 | $12,400 | $7,100 | $5,300 |
| 2018 | $282 | $10,600 | $6,000 | $4,600 |
| 2017 | $782 | $10,600 | $6,000 | $4,600 |
| 2016 | $1,357 | $10,200 | $5,800 | $4,400 |
| 2015 | $268 | $10,200 | $5,800 | $4,400 |
| 2014 | $757 | $10,000 | $5,600 | $4,400 |
Source: Public Records
Map
Nearby Homes