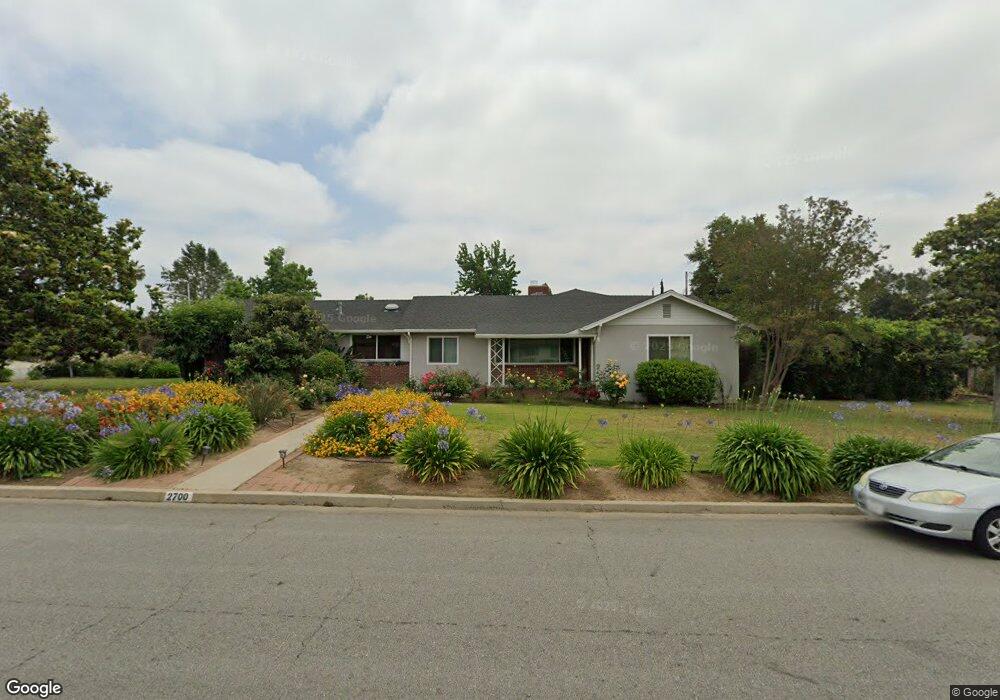
2700 E Vanderhoof Dr West Covina, CA 91791
South Hills NeighborhoodEstimated Value: $1,382,000 - $1,627,000
4
Beds
4
Baths
2,965
Sq Ft
$501/Sq Ft
Est. Value
About This Home
This home is located at 2700 E Vanderhoof Dr, West Covina, CA 91791 and is currently estimated at $1,484,968, approximately $500 per square foot. 2700 E Vanderhoof Dr is a home located in Los Angeles County with nearby schools including Mesa Elementary School, South Hills High School, and Christ Lutheran School.
Ownership History
Date
Name
Owned For
Owner Type
Purchase Details
Closed on
Jul 18, 2003
Sold by
Tsai Wen Chin
Bought by
Chiang Chin Chih and Chiang Bee Lang
Current Estimated Value
Home Financials for this Owner
Home Financials are based on the most recent Mortgage that was taken out on this home.
Original Mortgage
$100,000
Interest Rate
5.17%
Mortgage Type
Purchase Money Mortgage
Purchase Details
Closed on
Jul 19, 1999
Sold by
Chiang Chin Chih and Chiang Bee Lang
Bought by
Chiang Chin Chih and Chiang Bee Lang
Home Financials for this Owner
Home Financials are based on the most recent Mortgage that was taken out on this home.
Original Mortgage
$100,000
Interest Rate
7.64%
Purchase Details
Closed on
Feb 11, 1999
Sold by
Chen Lawrence K
Bought by
Chiang Chin Chih and Chiang Bee Lang
Create a Home Valuation Report for This Property
The Home Valuation Report is an in-depth analysis detailing your home's value as well as a comparison with similar homes in the area
Home Values in the Area
Average Home Value in this Area
Purchase History
| Date | Buyer | Sale Price | Title Company |
|---|---|---|---|
| Chiang Chin Chih | -- | Fidelity National Title Co | |
| Chiang Chin Chih | -- | Southland Title Corporation | |
| Tsai Wen Chin | -- | Southland Title Corporation | |
| Chiang Chin Chih | $280,000 | -- |
Source: Public Records
Mortgage History
| Date | Status | Borrower | Loan Amount |
|---|---|---|---|
| Closed | Chiang Chin Chih | $100,000 | |
| Previous Owner | Chiang Chin Chih | $100,000 |
Source: Public Records
Tax History Compared to Growth
Tax History
| Year | Tax Paid | Tax Assessment Tax Assessment Total Assessment is a certain percentage of the fair market value that is determined by local assessors to be the total taxable value of land and additions on the property. | Land | Improvement |
|---|---|---|---|---|
| 2025 | $7,049 | $548,430 | $277,963 | $270,467 |
| 2024 | $7,049 | $537,677 | $272,513 | $265,164 |
| 2023 | $6,949 | $527,135 | $267,170 | $259,965 |
| 2022 | $6,858 | $516,800 | $261,932 | $254,868 |
| 2021 | $6,749 | $506,668 | $256,797 | $249,871 |
| 2020 | $6,655 | $501,473 | $254,164 | $247,309 |
| 2019 | $6,587 | $491,641 | $249,181 | $242,460 |
| 2018 | $6,189 | $482,002 | $244,296 | $237,706 |
| 2016 | $5,824 | $463,287 | $234,810 | $228,477 |
| 2015 | $5,670 | $456,329 | $231,283 | $225,046 |
| 2014 | $5,598 | $447,391 | $226,753 | $220,638 |
Source: Public Records
Map
Nearby Homes
- 2837 E Mesa Dr
- 2551 E Larkwood St
- 512 S Barranca St
- 3033 E Sunset Hill Dr
- 130 S Barranca St Unit 302
- 2249 E Rio Verde Dr
- 920 S Spring Meadow Dr
- 2147 E Rio Verde Dr
- 950 S Spring Meadow Dr
- 3264 E Holt Ave
- 768 S Barranca Ave
- 802 S Hollenbeck St
- 417 S Charvers Ave
- 780 S Briargate Ln
- 759 S Briargate Ln
- 2828 Far View Ln
- 622 E Workman St Unit 12
- 110 S Baymar St
- 3329 E Virginia Ave
- 1103 Novarro St
- 2652 E Vanderhoof Dr
- 2707 E Vanderhoof Dr
- 2726 E Sunset Hill Dr
- 2722 E Vanderhoof Dr
- 2715 E Vanderhoof Dr
- 2653 E Vanderhoof Dr
- 2729 E Sunset Hill Dr
- 2642 E Vanderhoof Dr
- 2641 E Vanderhoof Dr
- 2734 E Sunset Hill Dr
- 2727 E Vanderhoof Dr
- 2730 E Vanderhoof Dr
- 2741 E Sunset Hill Dr
- 2632 E Vanderhoof Dr
- 2633 E Vanderhoof Dr
- 2747 E Sunset Hill Dr
- 2744 E Sunset Hill Dr
- 2738 E Vanderhoof Dr
- 2743 E Vanderhoof Dr
- 2622 E Vanderhoof Dr