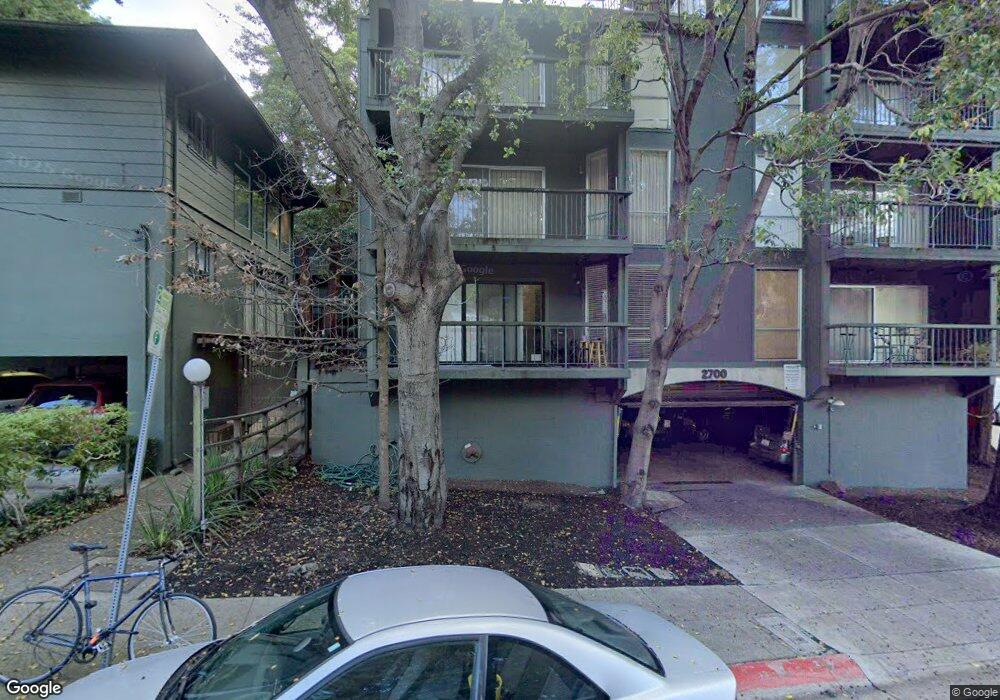
2700 Le Conte Ave Unit 19 Berkeley, CA 94709
North Berkeley NeighborhoodEstimated Value: $651,000 - $700,000
1
Bed
1
Bath
682
Sq Ft
$985/Sq Ft
Est. Value
About This Home
This home is located at 2700 Le Conte Ave Unit 19, Berkeley, CA 94709 and is currently estimated at $671,940, approximately $985 per square foot. 2700 Le Conte Ave Unit 19 is a home located in Alameda County with nearby schools including Berkeley Arts Magnet at Whittier School, Washington Elementary School, and Cragmont Elementary School.
Ownership History
Date
Name
Owned For
Owner Type
Purchase Details
Closed on
Aug 2, 2023
Sold by
Xu Simon Dong Zhe
Bought by
Ko Family Trust and Ko
Current Estimated Value
Purchase Details
Closed on
Jun 20, 2017
Sold by
Hallquist John O
Bought by
Xu Simon Dong Zhe
Purchase Details
Closed on
Jul 26, 2001
Sold by
Hallquist John O and Hallquist Candace E
Bought by
Hallquist John O
Purchase Details
Closed on
Jul 12, 1999
Sold by
Edwin Hsu
Bought by
Hallquist John O and Hallquist Candace E
Purchase Details
Closed on
Jul 11, 1995
Sold by
Yang Charles C and Yang Sachiko H
Bought by
Hsu Edwin
Purchase Details
Closed on
Jan 19, 1993
Sold by
Yang Charles C and Yang Sachiko H
Bought by
Yang Charles C and Yang Sachiko H
Create a Home Valuation Report for This Property
The Home Valuation Report is an in-depth analysis detailing your home's value as well as a comparison with similar homes in the area
Home Values in the Area
Average Home Value in this Area
Purchase History
| Date | Buyer | Sale Price | Title Company |
|---|---|---|---|
| Ko Family Trust | $705,000 | Old Republic Title Company | |
| Xu Simon Dong Zhe | $670,000 | Chicago Title Company | |
| Hallquist John O | -- | -- | |
| Hallquist John O | $215,000 | Placer Title Company | |
| Hsu Edwin | $155,000 | North American Title Company | |
| Yang Charles C | -- | -- |
Source: Public Records
Tax History
| Year | Tax Paid | Tax Assessment Tax Assessment Total Assessment is a certain percentage of the fair market value that is determined by local assessors to be the total taxable value of land and additions on the property. | Land | Improvement |
|---|---|---|---|---|
| 2025 | $10,550 | $719,100 | $219,300 | $499,800 |
| 2024 | $10,550 | $705,000 | $215,000 | $490,000 |
| 2023 | $10,929 | $747,384 | $224,215 | $523,169 |
| 2022 | $10,749 | $725,731 | $219,819 | $512,912 |
| 2021 | $10,784 | $711,367 | $215,510 | $502,857 |
| 2020 | $10,254 | $711,003 | $213,301 | $497,702 |
| 2019 | $9,903 | $697,067 | $209,120 | $487,947 |
| 2018 | $9,746 | $683,400 | $205,020 | $478,380 |
| 2017 | $4,815 | $284,720 | $85,416 | $199,304 |
| 2016 | $4,626 | $279,138 | $83,741 | $195,397 |
| 2015 | $4,560 | $274,945 | $82,483 | $192,462 |
| 2014 | $4,517 | $269,560 | $80,868 | $188,692 |
Source: Public Records
Map
Nearby Homes
- 2700 Le Conte Ave Unit 301
- 2700 Le Conte Ave Unit 402
- 2704 Le Conte Ave Unit 4
- 2634 Virginia St Unit 13
- 2451 Le Conte Ave
- 2340 Virginia St
- 2201 Virginia St Unit 2
- 209 Fairlawn Dr
- 1375 Queens Rd
- 0 Queens Rd Unit ML82024219
- 0 Panoramic Way Unit 41118724
- 1468 Summit Rd
- 1444 Walnut St
- 2 Panoramic Way Unit 105
- 2 Panoramic Way Unit 304
- 2907 Channing Way
- 2015 Delaware St
- 2015 Delaware St Unit A
- 1610 Milvia St
- 161 Panoramic Way
- 2700 Le Conte Ave Unit 205
- 2700 Le Conte Ave Unit 501
- 2700 Le Conte Ave Unit 204
- 2700 Le Conte Ave Unit 304
- 2700 Le Conte Ave Unit 303
- 2700 Le Conte Ave Unit 305
- 2700 Le Conte Ave Unit 203
- 2700 Le Conte Ave Unit 403
- 2700 Le Conte Ave Unit 406
- 2700 Le Conte Ave Unit 302
- 2700 Le Conte Ave Unit 500
- 2700 Le Conte Ave Unit 3
- 2700 Le Conte Ave Unit 7
- 2700 Le Conte Ave Unit 10
- 2700 Le Conte Ave Unit 11
- 2700 Le Conte Ave Unit 8
- 2700 Le Conte Ave Unit 12
- 2700 Le Conte Ave Unit 17
- 2700 Le Conte Ave Unit 5
- 2700 Le Conte Ave Unit 16
Your Personal Tour Guide
Ask me questions while you tour the home.