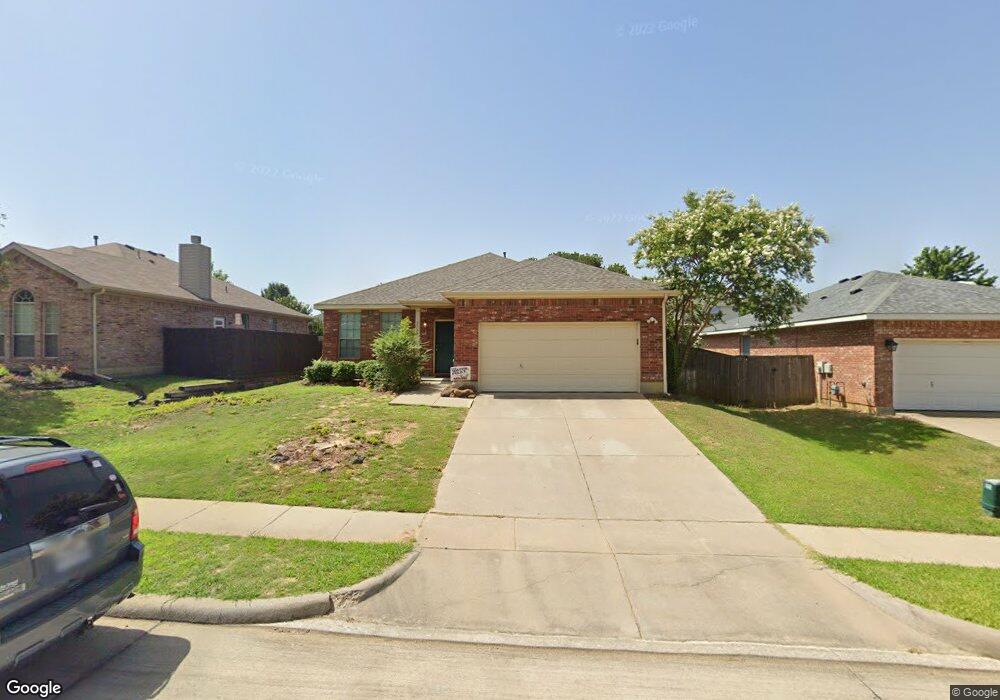
2700 Weslayan Dr Denton, TX 76210
South Denton NeighborhoodEstimated Value: $342,549 - $369,000
3
Beds
2
Baths
1,908
Sq Ft
$187/Sq Ft
Est. Value
About This Home
This home is located at 2700 Weslayan Dr, Denton, TX 76210 and is currently estimated at $356,137, approximately $186 per square foot. 2700 Weslayan Dr is a home located in Denton County with nearby schools including Nelson Elementary School, McMath Middle School, and Denton High School.
Ownership History
Date
Name
Owned For
Owner Type
Purchase Details
Closed on
Sep 1, 2016
Sold by
Ahn Chun H
Bought by
Radi Properties Llc
Current Estimated Value
Purchase Details
Closed on
Jun 23, 2015
Sold by
Henry Draco and Henry Kimberly K
Bought by
Ahn Chun H
Purchase Details
Closed on
Aug 9, 2004
Sold by
Morgan Stephen and Morgan Lisa
Bought by
Henry Draco and Henry Kimberly K
Home Financials for this Owner
Home Financials are based on the most recent Mortgage that was taken out on this home.
Original Mortgage
$98,455
Interest Rate
6%
Mortgage Type
FHA
Purchase Details
Closed on
Mar 20, 2003
Sold by
Goodman Family Of Builders Lp
Bought by
Morgan Stephen and Morgan Lisa
Home Financials for this Owner
Home Financials are based on the most recent Mortgage that was taken out on this home.
Original Mortgage
$123,300
Interest Rate
5.83%
Create a Home Valuation Report for This Property
The Home Valuation Report is an in-depth analysis detailing your home's value as well as a comparison with similar homes in the area
Home Values in the Area
Average Home Value in this Area
Purchase History
| Date | Buyer | Sale Price | Title Company |
|---|---|---|---|
| Radi Properties Llc | -- | None Available | |
| Ahn Chun H | -- | Stewart | |
| Henry Draco | -- | Fatco | |
| Morgan Stephen | -- | -- |
Source: Public Records
Mortgage History
| Date | Status | Borrower | Loan Amount |
|---|---|---|---|
| Previous Owner | Henry Draco | $98,455 | |
| Previous Owner | Morgan Stephen | $123,300 |
Source: Public Records
Tax History Compared to Growth
Tax History
| Year | Tax Paid | Tax Assessment Tax Assessment Total Assessment is a certain percentage of the fair market value that is determined by local assessors to be the total taxable value of land and additions on the property. | Land | Improvement |
|---|---|---|---|---|
| 2025 | $5,868 | $320,000 | $79,950 | $240,050 |
| 2024 | $5,868 | $304,000 | $79,950 | $224,050 |
| 2023 | $6,435 | $337,000 | $76,865 | $260,135 |
| 2022 | $5,710 | $269,000 | $63,038 | $205,962 |
| 2021 | $5,802 | $261,000 | $43,050 | $217,950 |
| 2020 | $5,451 | $238,479 | $43,050 | $195,429 |
| 2019 | $5,659 | $237,175 | $43,050 | $194,125 |
| 2018 | $5,200 | $215,250 | $43,050 | $172,200 |
| 2017 | $5,064 | $204,880 | $36,900 | $167,980 |
| 2016 | $4,949 | $188,793 | $36,900 | $151,893 |
| 2015 | $3,905 | $167,467 | $36,900 | $130,567 |
| 2014 | $3,905 | $156,093 | $36,900 | $119,193 |
| 2013 | -- | $136,521 | $36,900 | $99,621 |
Source: Public Records
Map
Nearby Homes
- 2616 Hilcroft Ave
- 2713 Hilcroft Ave
- 2617 Bissonet Dr
- 2617 Hollow Ridge Dr
- 2617 Hereford Rd
- 2804 Hollow Ridge Dr
- 2721 Arabian Ave
- 2817 Hereford Rd
- 2601 Pinto Dr
- 3900 Gessner Dr
- 3448 Tuscan Hills Cir
- 2713 Clubhouse Dr
- 3428 Tuscan Hills Cir
- 3000 Bella Lago Dr
- 2913 Montebello Dr
- 2917 Montebello Dr
- 2121 Corsair Ln
- 2600 Pioneer Dr
- 3432 Sundown Blvd
- 3009 Montebello Dr
- 2616 Weslayan Dr
- 2704 Weslayan Dr
- 2701 Hilcroft Ave
- 2612 Weslayan Dr
- 2708 Weslayan Dr
- 2617 Hilcroft Ave
- 2705 Hilcroft Ave
- 2613 Hilcroft Ave
- 2709 Hilcroft Ave
- 2701 Weslayan Dr
- 2705 Weslayan Dr
- 2608 Weslayan Dr
- 2712 Weslayan Dr
- 2621 Weslayan Dr
- 2709 Weslayan Dr
- 2609 Hilcroft Ave
- 2617 Weslayan Dr
- 2713 Weslayan Dr
- 2604 Weslayan Dr
- 2716 Weslayan Dr