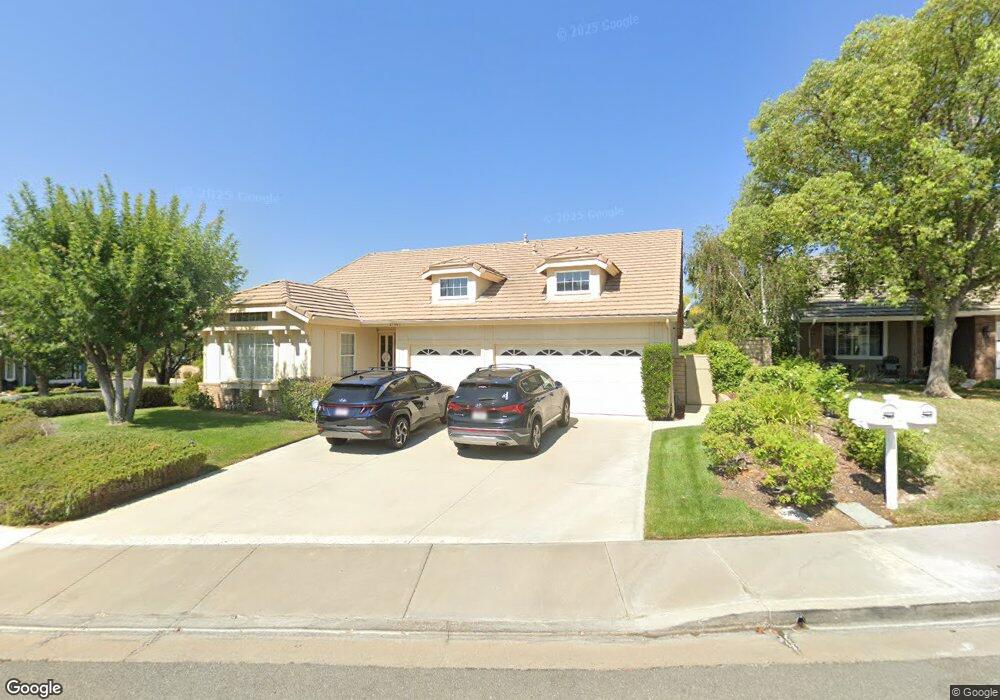
27003 Roswell Ct Valencia, CA 91354
Estimated Value: $947,519 - $1,137,000
3
Beds
2
Baths
2,135
Sq Ft
$479/Sq Ft
Est. Value
About This Home
This home is located at 27003 Roswell Ct, Valencia, CA 91354 and is currently estimated at $1,022,630, approximately $478 per square foot. 27003 Roswell Ct is a home located in Los Angeles County with nearby schools including Charles Helmers Elementary School, Rio Norte Junior High School, and Valencia High School.
Ownership History
Date
Name
Owned For
Owner Type
Purchase Details
Closed on
Aug 17, 2022
Sold by
Dziubala Family Trust
Bought by
Dziubala Sharon K and Dziubala Sharon K
Current Estimated Value
Purchase Details
Closed on
Feb 8, 1997
Sold by
Dziubala Thomas J and Dziubala Sharon K
Bought by
Dziubala Thomas J and Dziubala Sharon E
Purchase Details
Closed on
Oct 13, 1993
Sold by
Epac Communities Inc
Bought by
Dziubala Thomas J and Dziubala Sharon K
Home Financials for this Owner
Home Financials are based on the most recent Mortgage that was taken out on this home.
Original Mortgage
$110,000
Interest Rate
6.97%
Purchase Details
Closed on
Oct 8, 1993
Sold by
The Newhall Land & Farming Company
Bought by
Epac Communities Inc
Home Financials for this Owner
Home Financials are based on the most recent Mortgage that was taken out on this home.
Original Mortgage
$110,000
Interest Rate
6.97%
Create a Home Valuation Report for This Property
The Home Valuation Report is an in-depth analysis detailing your home's value as well as a comparison with similar homes in the area
Home Values in the Area
Average Home Value in this Area
Purchase History
| Date | Buyer | Sale Price | Title Company |
|---|---|---|---|
| Dziubala Sharon K | -- | -- | |
| Dziubala Thomas J | -- | -- | |
| Dziubala Thomas J | $310,000 | Chicago Title Company | |
| Epac Communities Inc | -- | Chicago Title Company |
Source: Public Records
Mortgage History
| Date | Status | Borrower | Loan Amount |
|---|---|---|---|
| Previous Owner | Dziubala Thomas J | $110,000 |
Source: Public Records
Tax History Compared to Growth
Tax History
| Year | Tax Paid | Tax Assessment Tax Assessment Total Assessment is a certain percentage of the fair market value that is determined by local assessors to be the total taxable value of land and additions on the property. | Land | Improvement |
|---|---|---|---|---|
| 2025 | $8,081 | $526,870 | $263,435 | $263,435 |
| 2024 | $8,081 | $516,540 | $258,270 | $258,270 |
| 2023 | $7,864 | $506,412 | $253,206 | $253,206 |
| 2022 | $7,869 | $496,484 | $248,242 | $248,242 |
| 2021 | $7,649 | $486,750 | $243,375 | $243,375 |
| 2019 | $7,326 | $472,314 | $236,157 | $236,157 |
| 2018 | $7,136 | $463,054 | $231,527 | $231,527 |
| 2016 | $6,665 | $445,076 | $222,538 | $222,538 |
| 2015 | $6,444 | $438,392 | $219,196 | $219,196 |
| 2014 | $6,426 | $429,806 | $214,903 | $214,903 |
Source: Public Records
Map
Nearby Homes
- 23141 La Granja Dr
- 23054 La Granja Dr
- 26963 Hillsborough Pkwy Unit 71
- 26967 Hillsborough Pkwy Unit 77
- 26925 Hillsborough Pkwy Unit 96
- 23321 Beachcomber Ln
- 26951 Hillsborough Pkwy Unit 47
- 23132 Posada Dr
- 23422 Westford Place
- 23402 Brookdale Ln Unit 56
- 26841 Shorebreak Ln Unit 35
- 23605 Muir Trail Unit 78
- 23612 Muir Trail Unit 74
- 23633 Big Sky Walk Unit 129
- 27139 Vista Encantada Dr
- 27109 Teton Trail Unit 90
- 27251 Blakely Place
- 26861 Cuatro Milpas St
- 27358 Brighton Ln
- 26953 Cuatro Milpas St
- 27011 Roswell Ct
- 27015 Roswell Ct
- 23248 Pelham Place
- 27004 Lamberton Place
- 23242 Pelham Place
- 27002 Roswell Ct
- 23304 Pelham Place
- 27012 Lamberton Place
- 23236 Pelham Place
- 27012 Roswell Ct
- 27014 Roswell Ct
- 23310 Pelham Place
- 23228 Pelham Place
- 27020 Lamberton Place
- 23257 Sherwood Place
- 23249 Sherwood Place
- 23267 Sherwood Place
- 23241 Sherwood Place
- 23316 Pelham Place
- 23220 Pelham Place