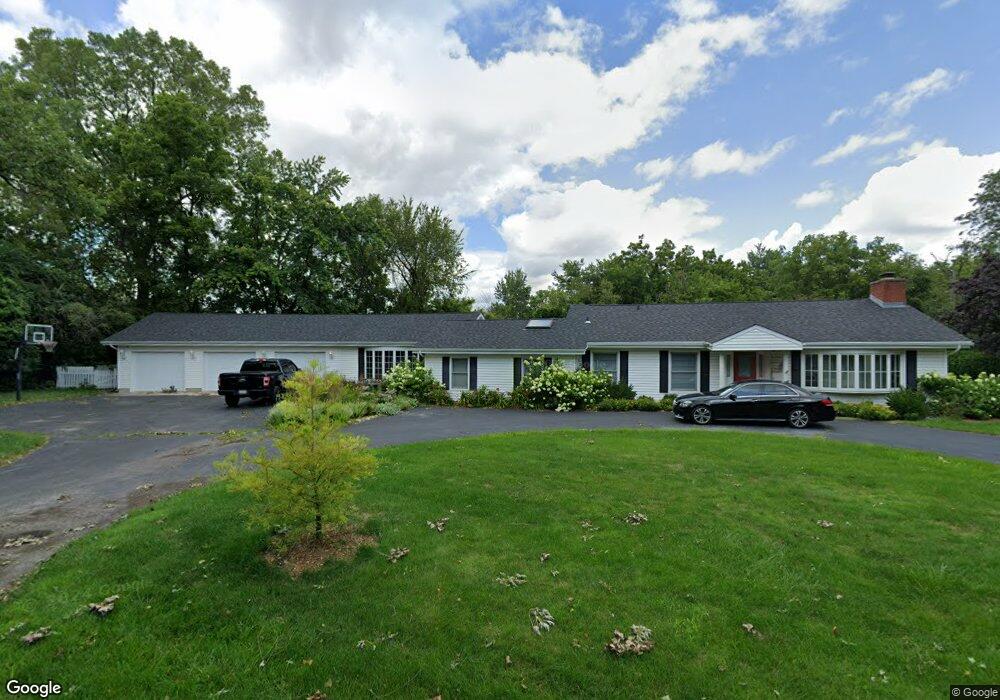
2701 1st Private Rd Flossmoor, IL 60422
Estimated Value: $340,809 - $458,000
3
Beds
2
Baths
2,467
Sq Ft
$160/Sq Ft
Est. Value
About This Home
This home is located at 2701 1st Private Rd, Flossmoor, IL 60422 and is currently estimated at $395,452, approximately $160 per square foot. 2701 1st Private Rd is a home located in Cook County with nearby schools including Western Avenue Elementary School, Parker Junior High School, and Homewood-Flossmoor High School.
Ownership History
Date
Name
Owned For
Owner Type
Purchase Details
Closed on
Sep 2, 2010
Sold by
Laveist Wilbert F and Laveist Rita M
Bought by
Burton Michelle Y
Current Estimated Value
Purchase Details
Closed on
Jun 8, 2006
Sold by
Obrien Jay T and Obrien Susan A
Bought by
Laveist Wilbert F and Laveist Rita M
Home Financials for this Owner
Home Financials are based on the most recent Mortgage that was taken out on this home.
Original Mortgage
$65,000
Interest Rate
6.72%
Mortgage Type
Stand Alone Second
Purchase Details
Closed on
May 29, 2001
Sold by
Obrien Jay T and Obrien Susan A
Bought by
Obrien Jay T and Obrien Susan A
Create a Home Valuation Report for This Property
The Home Valuation Report is an in-depth analysis detailing your home's value as well as a comparison with similar homes in the area
Home Values in the Area
Average Home Value in this Area
Purchase History
| Date | Buyer | Sale Price | Title Company |
|---|---|---|---|
| Burton Michelle Y | $129,000 | None Available | |
| Laveist Wilbert F | $325,000 | None Available | |
| Obrien Jay T | -- | -- |
Source: Public Records
Mortgage History
| Date | Status | Borrower | Loan Amount |
|---|---|---|---|
| Previous Owner | Laveist Wilbert F | $65,000 | |
| Previous Owner | Laveist Wilbert F | $260,000 |
Source: Public Records
Tax History
| Year | Tax Paid | Tax Assessment Tax Assessment Total Assessment is a certain percentage of the fair market value that is determined by local assessors to be the total taxable value of land and additions on the property. | Land | Improvement |
|---|---|---|---|---|
| 2025 | $12,769 | $30,000 | $13,084 | $16,916 |
| 2024 | $12,769 | $30,000 | $13,084 | $16,916 |
| 2023 | $16,635 | $30,000 | $13,084 | $16,916 |
| 2022 | $16,635 | $30,927 | $11,377 | $19,550 |
| 2021 | $16,665 | $30,927 | $11,377 | $19,550 |
| 2020 | $15,964 | $30,927 | $11,377 | $19,550 |
| 2019 | $15,759 | $29,243 | $10,239 | $19,004 |
| 2018 | $15,166 | $29,243 | $10,239 | $19,004 |
| 2017 | $14,890 | $29,243 | $10,239 | $19,004 |
| 2016 | $13,043 | $24,628 | $9,101 | $15,527 |
| 2015 | $13,106 | $24,628 | $9,101 | $15,527 |
| 2014 | $12,859 | $24,628 | $9,101 | $15,527 |
| 2013 | $13,763 | $28,805 | $9,101 | $19,704 |
Source: Public Records
Map
Nearby Homes
- 1421 Berry Ln
- 1430 Brassie Ave
- 1741 Oak Lane Rd
- 1248 Berry Ln
- 2708 Hawthorne Ln
- 1418 Western Ave
- 2937 Kathleen Ln
- 1141 Leavitt Ave Unit 115
- 1139 Leavitt Ave Unit 203
- 1139 Leavitt Ave Unit 212
- 1117 Leavitt Ave Unit 110
- 2931 Sunset Ave
- 2817 Flossmoor Rd
- 2622 Central Dr Unit 2N
- 2640 Central Dr Unit 1-N
- 1816 Quail Ct
- 2929 Flossmoor Rd
- 3038 Candlewood Ct Unit 24
- 3118 Elaine Ct Unit 232
- 1002 Douglas Ave
- 2647 1st Private Rd
- 2705 1st Private Rd
- 2637 1st Private Rd
- 2710 1st Private Rd
- 2646 1st Private Rd
- 2640 1st Private Rd
- 2633 1st Private Rd
- 1431 Lawrence Crescent
- 2630 1st Private Rd
- 1427 Lawrence Crescent
- 2703 2nd Private Rd
- 2711 2nd Private Rd
- 2645 2nd Private Rd
- 2717 2nd Private Rd
- 2637 2nd Private Rd
- 2615 Brassie Ave
- 1450 Bunker Ave
- 1417 Lawrence Crescent
- 1540 Brassie Ave
- 1411 Lawrence Crescent
Your Personal Tour Guide
Ask me questions while you tour the home.