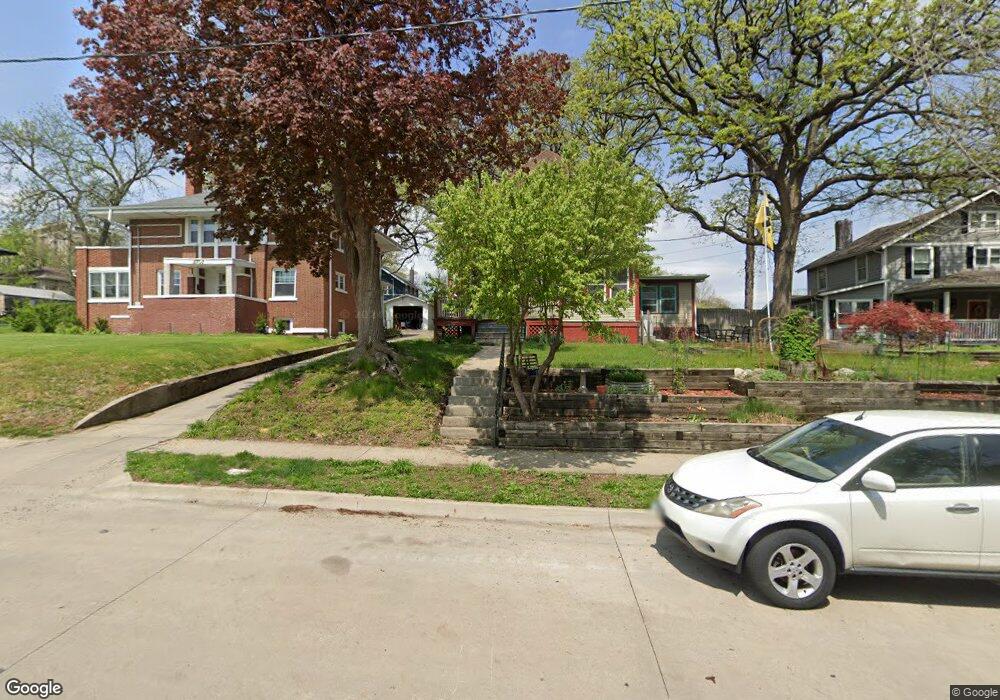
2701 High St Des Moines, IA 50312
Woodland Heights NeighborhoodEstimated Value: $248,000 - $305,000
4
Beds
2
Baths
2,440
Sq Ft
$115/Sq Ft
Est. Value
About This Home
This home is located at 2701 High St, Des Moines, IA 50312 and is currently estimated at $280,692, approximately $115 per square foot. 2701 High St is a home located in Polk County with nearby schools including Greenwood Elementary School and Roosevelt High School.
Ownership History
Date
Name
Owned For
Owner Type
Purchase Details
Closed on
Mar 31, 2021
Sold by
Nemmers Michael S and Nemmers Jo Ann
Bought by
Callahan William and Callahan Kimberly D
Current Estimated Value
Home Financials for this Owner
Home Financials are based on the most recent Mortgage that was taken out on this home.
Original Mortgage
$187,035
Outstanding Balance
$168,136
Interest Rate
3%
Mortgage Type
FHA
Estimated Equity
$112,556
Purchase Details
Closed on
Mar 26, 2021
Sold by
Nemmers Michael S and Nemmers Jo Ann
Bought by
Callahan William and Callahan Kimberly D
Home Financials for this Owner
Home Financials are based on the most recent Mortgage that was taken out on this home.
Original Mortgage
$187,035
Outstanding Balance
$168,136
Interest Rate
3%
Mortgage Type
FHA
Estimated Equity
$112,556
Purchase Details
Closed on
Dec 23, 2010
Sold by
Lahey Fern A
Bought by
Nemmers Michael S and Nemmers Jo Ann
Home Financials for this Owner
Home Financials are based on the most recent Mortgage that was taken out on this home.
Original Mortgage
$122,250
Interest Rate
4.16%
Mortgage Type
New Conventional
Purchase Details
Closed on
Jan 22, 2010
Sold by
Schmacker John
Bought by
Lahey Fern A
Purchase Details
Closed on
Jul 14, 1998
Sold by
Prasher John A
Bought by
Lahey Mark L
Create a Home Valuation Report for This Property
The Home Valuation Report is an in-depth analysis detailing your home's value as well as a comparison with similar homes in the area
Home Values in the Area
Average Home Value in this Area
Purchase History
| Date | Buyer | Sale Price | Title Company |
|---|---|---|---|
| Callahan William | $200,000 | None Available | |
| Callahan William | $200,000 | None Listed On Document | |
| Nemmers Michael S | $162,500 | None Available | |
| Lahey Fern A | -- | None Available | |
| Lahey Mark L | -- | -- |
Source: Public Records
Mortgage History
| Date | Status | Borrower | Loan Amount |
|---|---|---|---|
| Open | Callahan William | $187,035 | |
| Closed | Callahan William | $187,035 | |
| Previous Owner | Nemmers Michael S | $122,250 |
Source: Public Records
Tax History Compared to Growth
Tax History
| Year | Tax Paid | Tax Assessment Tax Assessment Total Assessment is a certain percentage of the fair market value that is determined by local assessors to be the total taxable value of land and additions on the property. | Land | Improvement |
|---|---|---|---|---|
| 2025 | $4,540 | $272,600 | $37,400 | $235,200 |
| 2024 | $4,540 | $241,200 | $32,900 | $208,300 |
| 2023 | $4,198 | $241,200 | $32,900 | $208,300 |
| 2022 | $4,164 | $187,000 | $26,800 | $160,200 |
| 2021 | $4,792 | $187,000 | $26,800 | $160,200 |
| 2020 | $4,978 | $192,000 | $24,000 | $168,000 |
| 2019 | $4,620 | $192,000 | $24,000 | $168,000 |
| 2018 | $4,574 | $171,900 | $20,900 | $151,000 |
| 2017 | $4,148 | $171,900 | $20,900 | $151,000 |
| 2016 | $4,042 | $163,600 | $19,700 | $143,900 |
| 2015 | $4,042 | $163,600 | $19,700 | $143,900 |
| 2014 | $3,588 | $145,300 | $17,500 | $127,800 |
Source: Public Records
Map
Nearby Homes