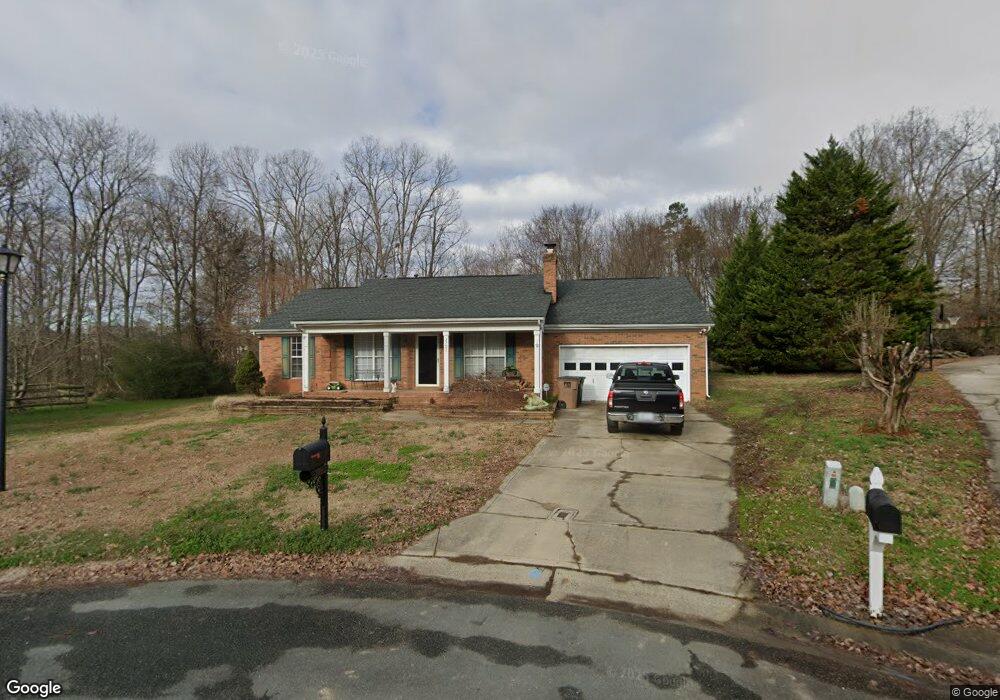
2701 Mendelson Ct Monroe, NC 28110
Estimated Value: $328,000 - $354,942
3
Beds
2
Baths
1,413
Sq Ft
$238/Sq Ft
Est. Value
About This Home
This home is located at 2701 Mendelson Ct, Monroe, NC 28110 and is currently estimated at $336,736, approximately $238 per square foot. 2701 Mendelson Ct is a home located in Union County with nearby schools including Shiloh Valley Primary School, Shiloh Valley Elementary School, and Sun Valley Middle School.
Ownership History
Date
Name
Owned For
Owner Type
Purchase Details
Closed on
Jan 24, 2006
Sold by
Griffin William R and Griffin Elizabeth
Bought by
Cozzen Carla
Current Estimated Value
Home Financials for this Owner
Home Financials are based on the most recent Mortgage that was taken out on this home.
Original Mortgage
$114,320
Outstanding Balance
$59,581
Interest Rate
5.25%
Mortgage Type
Fannie Mae Freddie Mac
Estimated Equity
$277,155
Purchase Details
Closed on
Mar 29, 2001
Sold by
Sellars Linda D
Bought by
Griffin William R
Home Financials for this Owner
Home Financials are based on the most recent Mortgage that was taken out on this home.
Original Mortgage
$125,530
Interest Rate
7.02%
Mortgage Type
FHA
Purchase Details
Closed on
Jan 14, 1999
Sold by
Scott Michael C and Scott Nena W
Bought by
Sellers Linda D
Home Financials for this Owner
Home Financials are based on the most recent Mortgage that was taken out on this home.
Original Mortgage
$93,650
Interest Rate
6.72%
Create a Home Valuation Report for This Property
The Home Valuation Report is an in-depth analysis detailing your home's value as well as a comparison with similar homes in the area
Purchase History
| Date | Buyer | Sale Price | Title Company |
|---|---|---|---|
| Cozzen Carla | $143,000 | Multiple | |
| Griffin William R | $127,500 | -- | |
| Sellers Linda D | $125,000 | -- |
Source: Public Records
Mortgage History
| Date | Status | Borrower | Loan Amount |
|---|---|---|---|
| Open | Cozzen Carla | $114,320 | |
| Previous Owner | Griffin William R | $125,530 | |
| Previous Owner | Sellers Linda D | $93,650 |
Source: Public Records
Tax History
| Year | Tax Paid | Tax Assessment Tax Assessment Total Assessment is a certain percentage of the fair market value that is determined by local assessors to be the total taxable value of land and additions on the property. | Land | Improvement |
|---|---|---|---|---|
| 2025 | $2,352 | $350,600 | $0 | $0 |
| 2024 | $2,085 | $241,500 | $36,800 | $204,700 |
| 2023 | $2,056 | $241,500 | $36,800 | $204,700 |
| 2022 | $2,013 | $241,500 | $36,800 | $204,700 |
| 2021 | $2,011 | $241,500 | $36,800 | $204,700 |
| 2020 | $1,077 | $137,400 | $20,500 | $116,900 |
| 2019 | $1,422 | $137,400 | $20,500 | $116,900 |
| 2018 | $1,104 | $137,400 | $20,500 | $116,900 |
| 2017 | $1,491 | $137,400 | $20,500 | $116,900 |
| 2016 | $1,445 | $137,400 | $20,500 | $116,900 |
| 2015 | $1,153 | $137,400 | $20,500 | $116,900 |
| 2014 | $1,003 | $141,060 | $25,000 | $116,060 |
Source: Public Records
Map
Nearby Homes
- 1035 Barnette Farm Ln
- 1110 Hinson Forest Rd
- 1032 Barnette Farm Ln
- 5303 Rogers Rd
- 200 Sidney Ct
- 4710 Titus Ct
- 6004 Brook Valley Run
- 2006 Great Falls Dr
- 1112 Harkey Creek Dr
- 104 Pine Lake Dr
- 5412 Fulton Ridge Dr
- 4003 Salmon River Dr
- 3010 Council Fire Cir
- 3005 Council Fire Cir
- 3035 Proverbs Ct
- 4080 Holly Villa Cir
- 1302 Langdon Terrace Dr
- 4063 Holly Villa Cir
- 4043 Holly Villa Cir
- 5607 Fulton Ridge Dr
- 2700 Mendelson Ct
- 2706 Mendelson Ct
- 2709 Mendelson Ct
- 2726 Faircroft Way
- 2726 Faircroft Way Unit 153
- 5108 Spring Meadow Ln
- 2722 Faircroft Way
- 2730 Faircroft Way
- 2734 Faircroft Way
- 5106 Spring Meadow Ln
- 2718 Faircroft Way
- 5104 Spring Meadow Ln
- 4909 Sandstone Ln
- 5110 Spring Meadow Ln
- 5100 Spring Meadow Ln
- 2738 Faircroft Way
- 4908 Spring Meadow Ln
- 5112 Spring Meadow Ln
- 4900 Sandstone Ln
- 5004 Spring Meadow Ln
Your Personal Tour Guide
Ask me questions while you tour the home.