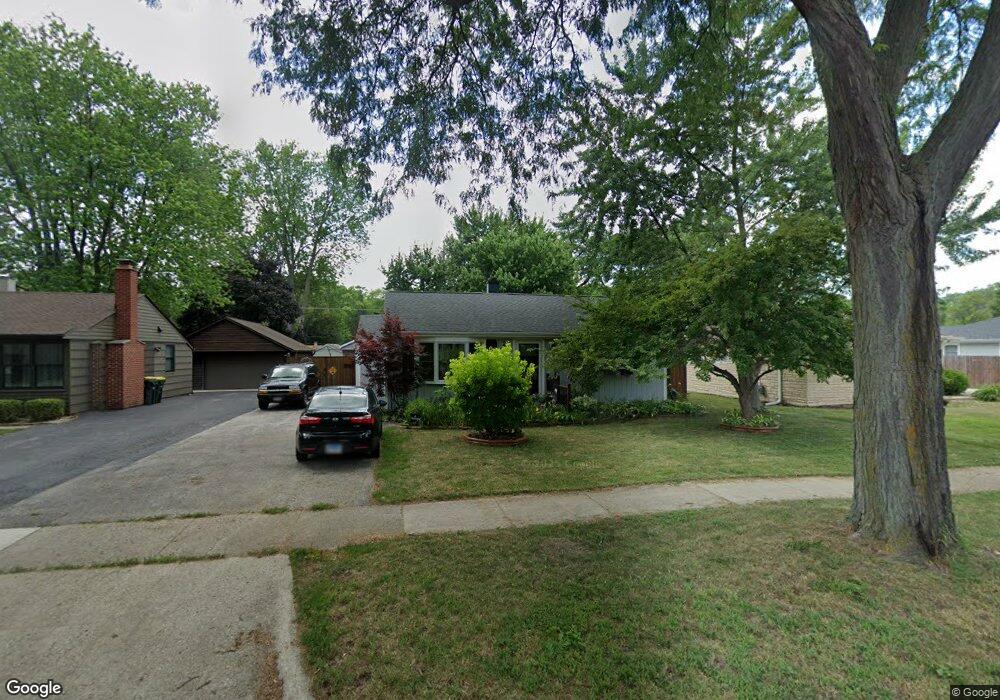
2701 Wilke Rd Rolling Meadows, IL 60008
Estimated Value: $274,000 - $310,049
3
Beds
2
Baths
885
Sq Ft
$327/Sq Ft
Est. Value
About This Home
This home is located at 2701 Wilke Rd, Rolling Meadows, IL 60008 and is currently estimated at $289,762, approximately $327 per square foot. 2701 Wilke Rd is a home located in Cook County with nearby schools including Kimball Hill Elementary School, King Elementary School, and Carl Sandburg Junior High School.
Ownership History
Date
Name
Owned For
Owner Type
Purchase Details
Closed on
Dec 11, 2006
Sold by
Humphries Gregory S
Bought by
Humphries Gregory S and Besinaiz Yvette A
Current Estimated Value
Home Financials for this Owner
Home Financials are based on the most recent Mortgage that was taken out on this home.
Original Mortgage
$234,650
Outstanding Balance
$156,840
Interest Rate
8.55%
Mortgage Type
New Conventional
Estimated Equity
$132,922
Purchase Details
Closed on
Jun 17, 2002
Sold by
Erbstoesser Diane A
Bought by
Humphries Gregory S
Home Financials for this Owner
Home Financials are based on the most recent Mortgage that was taken out on this home.
Original Mortgage
$151,235
Interest Rate
6.49%
Mortgage Type
FHA
Purchase Details
Closed on
Sep 1, 2000
Sold by
Rieber Aaron H and Erbstoesser Diane A
Bought by
Erbstoesser Diane A
Create a Home Valuation Report for This Property
The Home Valuation Report is an in-depth analysis detailing your home's value as well as a comparison with similar homes in the area
Home Values in the Area
Average Home Value in this Area
Purchase History
| Date | Buyer | Sale Price | Title Company |
|---|---|---|---|
| Humphries Gregory S | -- | Freedom Title Corp | |
| Humphries Gregory S | $137,000 | Agtf Inc | |
| Erbstoesser Diane A | -- | -- |
Source: Public Records
Mortgage History
| Date | Status | Borrower | Loan Amount |
|---|---|---|---|
| Open | Humphries Gregory S | $234,650 | |
| Previous Owner | Humphries Gregory S | $151,235 |
Source: Public Records
Tax History Compared to Growth
Tax History
| Year | Tax Paid | Tax Assessment Tax Assessment Total Assessment is a certain percentage of the fair market value that is determined by local assessors to be the total taxable value of land and additions on the property. | Land | Improvement |
|---|---|---|---|---|
| 2024 | $6,136 | $24,000 | $5,511 | $18,489 |
| 2023 | $5,840 | $24,000 | $5,511 | $18,489 |
| 2022 | $5,840 | $24,000 | $5,511 | $18,489 |
| 2021 | $4,332 | $17,077 | $3,256 | $13,821 |
| 2020 | $4,519 | $17,077 | $3,256 | $13,821 |
| 2019 | $4,554 | $19,081 | $3,256 | $15,825 |
| 2018 | $4,073 | $16,011 | $3,006 | $13,005 |
| 2017 | $4,009 | $16,011 | $3,006 | $13,005 |
| 2016 | $3,995 | $16,011 | $3,006 | $13,005 |
| 2015 | $3,667 | $14,271 | $2,755 | $11,516 |
| 2014 | $3,597 | $14,271 | $2,755 | $11,516 |
| 2013 | $3,492 | $14,271 | $2,755 | $11,516 |
Source: Public Records
Map
Nearby Homes
- 1615 W Johanna Terrace
- 12 S Princeton Ct
- 502 S Reuter Dr
- 222 S Dwyer Ave
- 2201 Kingfisher Ln
- 2100 Martin Ln
- 2611 South St
- 3208 Wren Ln
- 617 N Wilke Rd
- 3316 Trillium Cir
- 3125 Town Square Dr Unit 408
- 1506 W Northwest Hwy
- 3805 Wren Ln
- 751 S Dwyer Ave Unit F
- 3265 Kirchoff Rd Unit 223
- 105 S Mitchell Ave
- 318 W Wing St
- 1602 W Orchard Place Unit 1602C
- 314 W Wing St
- 3400 Wellington Ct Unit 306