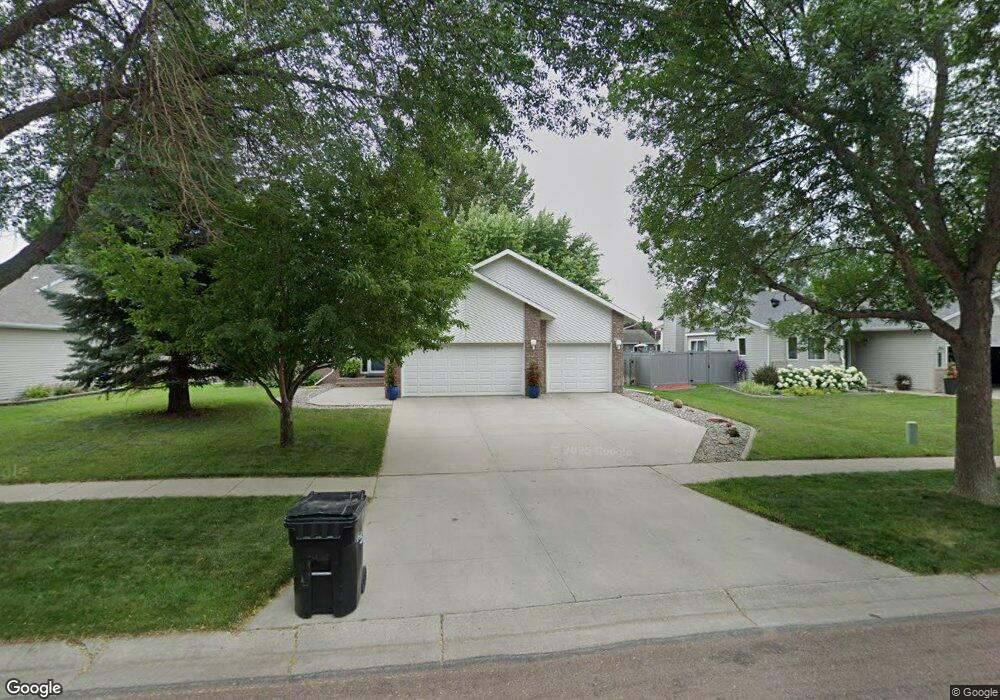
2702 39 Ave S Fargo, ND 58104
Stonebridge NeighborhoodEstimated Value: $414,000 - $460,000
3
Beds
2
Baths
2,984
Sq Ft
$147/Sq Ft
Est. Value
About This Home
This home is located at 2702 39 Ave S, Fargo, ND 58104 and is currently estimated at $439,024, approximately $147 per square foot. 2702 39 Ave S is a home located in Cass County with nearby schools including Centennial Elementary School, Discovery Middle School, and Fargo Davies High School.
Ownership History
Date
Name
Owned For
Owner Type
Purchase Details
Closed on
Oct 3, 2016
Sold by
Anderson Galen K and Anderson Lynnette
Bought by
Wehlander Sherrman S
Current Estimated Value
Home Financials for this Owner
Home Financials are based on the most recent Mortgage that was taken out on this home.
Original Mortgage
$225,000
Interest Rate
3.46%
Mortgage Type
New Conventional
Create a Home Valuation Report for This Property
The Home Valuation Report is an in-depth analysis detailing your home's value as well as a comparison with similar homes in the area
Home Values in the Area
Average Home Value in this Area
Purchase History
| Date | Buyer | Sale Price | Title Company |
|---|---|---|---|
| Wehlander Sherrman S | $315,000 | Title Co |
Source: Public Records
Mortgage History
| Date | Status | Borrower | Loan Amount |
|---|---|---|---|
| Open | Anderson James S | $180,000 | |
| Closed | Wehlander Sherrman S | $225,000 | |
| Previous Owner | Anderson Galen K | $178,500 | |
| Previous Owner | Anderson Galen | $50,000 | |
| Previous Owner | Anderson Galen | $40,000 |
Source: Public Records
Tax History Compared to Growth
Tax History
| Year | Tax Paid | Tax Assessment Tax Assessment Total Assessment is a certain percentage of the fair market value that is determined by local assessors to be the total taxable value of land and additions on the property. | Land | Improvement |
|---|---|---|---|---|
| 2024 | $4,675 | $191,700 | $35,600 | $156,100 |
| 2023 | $5,005 | $182,550 | $35,600 | $146,950 |
| 2022 | $4,591 | $164,400 | $37,250 | $127,150 |
| 2021 | $4,130 | $149,450 | $37,250 | $112,200 |
| 2020 | $4,107 | $149,450 | $37,250 | $112,200 |
| 2019 | $4,111 | $149,450 | $23,300 | $126,150 |
| 2018 | $4,060 | $149,450 | $23,300 | $126,150 |
| 2017 | $4,018 | $149,450 | $23,300 | $126,150 |
| 2016 | $3,745 | $151,250 | $23,300 | $127,950 |
| 2015 | $3,516 | $137,500 | $15,850 | $121,650 |
| 2014 | $3,282 | $125,000 | $15,850 | $109,150 |
| 2013 | $3,131 | $119,050 | $15,850 | $103,200 |
Source: Public Records
Map
Nearby Homes
- 2702 39th Ave S
- 2624 39th Ave SW
- 2624 39th Ave S
- 2708 39th Ave S
- 2701 39 1 2 Ave S
- 2701 39 1/2 Ave S
- 2625 39 1 2 Ave S
- 2709 39 1/2 Ave S
- 2625 39 1/2 Ave S
- 2616 39th Ave SW
- 2616 39th Ave S
- 2716 39th Ave S
- 2709 39 1 2 Ave S
- 2716 39th Ave SW
- 2701 39th Ave S
- 2617 39 1/2 Ave S
- 2717 39 1 2 Ave S
- 2625 39th Ave S
- 2717 39 1/2 Ave S
- 2617 39 1 2 Ave S