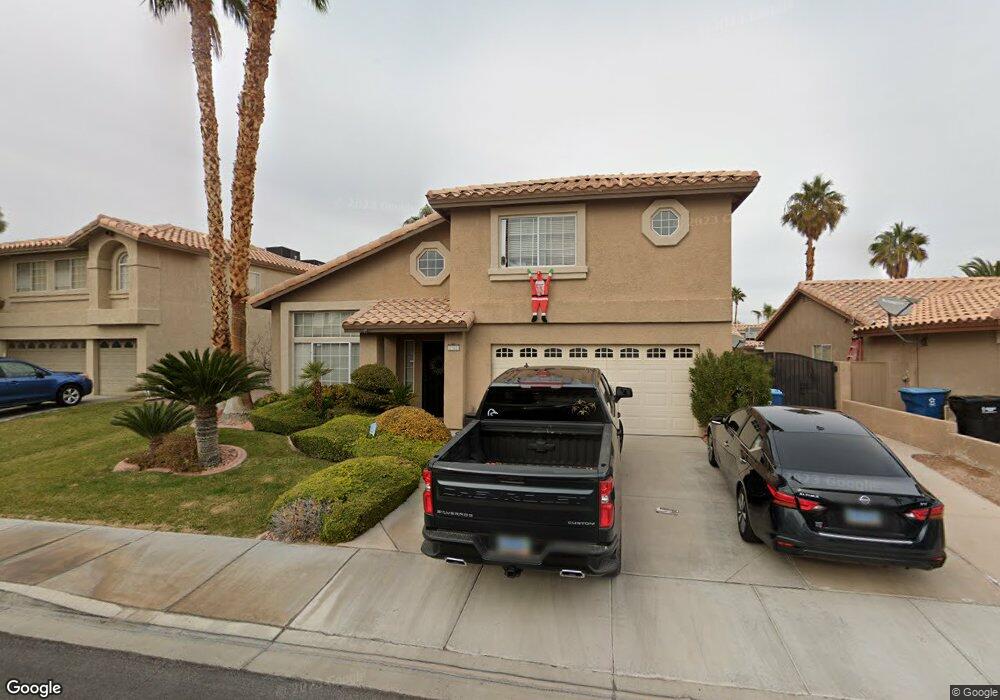
2702 Balsam Pear Ct Henderson, NV 89074
Green Valley North NeighborhoodEstimated Value: $516,021 - $582,000
4
Beds
3
Baths
2,213
Sq Ft
$248/Sq Ft
Est. Value
About This Home
This home is located at 2702 Balsam Pear Ct, Henderson, NV 89074 and is currently estimated at $548,005, approximately $247 per square foot. 2702 Balsam Pear Ct is a home located in Clark County with nearby schools including Aggie Roberts Elementary School, Jack Lund Schofield Middle School, and Silverado High School.
Ownership History
Date
Name
Owned For
Owner Type
Purchase Details
Closed on
May 10, 2007
Sold by
Stoudt Michael and Stoudt Cheri
Bought by
Welter Richard C and Welter Misty
Current Estimated Value
Home Financials for this Owner
Home Financials are based on the most recent Mortgage that was taken out on this home.
Original Mortgage
$284,000
Outstanding Balance
$172,465
Interest Rate
6.14%
Mortgage Type
Unknown
Estimated Equity
$375,540
Purchase Details
Closed on
May 19, 2003
Sold by
Thomson John W and Thomson Tiffani
Bought by
Stoudt Michael and Stoudt Cheri
Home Financials for this Owner
Home Financials are based on the most recent Mortgage that was taken out on this home.
Original Mortgage
$100,000
Interest Rate
3.12%
Mortgage Type
Purchase Money Mortgage
Purchase Details
Closed on
Apr 12, 1996
Sold by
American West Homes Inc
Bought by
Thomson John W and Thomson Tiffani
Home Financials for this Owner
Home Financials are based on the most recent Mortgage that was taken out on this home.
Original Mortgage
$159,650
Interest Rate
7.41%
Create a Home Valuation Report for This Property
The Home Valuation Report is an in-depth analysis detailing your home's value as well as a comparison with similar homes in the area
Home Values in the Area
Average Home Value in this Area
Purchase History
| Date | Buyer | Sale Price | Title Company |
|---|---|---|---|
| Welter Richard C | $355,000 | Equity Title Of Nevada | |
| Stoudt Michael | $243,000 | United Title Of Nevada | |
| Thomson John W | $164,500 | First American Title Co |
Source: Public Records
Mortgage History
| Date | Status | Borrower | Loan Amount |
|---|---|---|---|
| Open | Welter Richard C | $284,000 | |
| Previous Owner | Stoudt Michael | $100,000 | |
| Previous Owner | Thomson John W | $159,650 |
Source: Public Records
Tax History Compared to Growth
Tax History
| Year | Tax Paid | Tax Assessment Tax Assessment Total Assessment is a certain percentage of the fair market value that is determined by local assessors to be the total taxable value of land and additions on the property. | Land | Improvement |
|---|---|---|---|---|
| 2025 | $2,150 | $119,506 | $46,200 | $73,306 |
| 2024 | $2,088 | $119,506 | $46,200 | $73,306 |
| 2023 | $2,088 | $111,853 | $42,000 | $69,853 |
| 2022 | $2,027 | $104,652 | $40,600 | $64,052 |
| 2021 | $1,968 | $97,654 | $36,750 | $60,904 |
| 2020 | $1,908 | $97,267 | $36,750 | $60,517 |
| 2019 | $1,885 | $92,990 | $33,250 | $59,740 |
| 2018 | $1,799 | $79,183 | $21,700 | $57,483 |
| 2017 | $2,321 | $80,075 | $21,700 | $58,375 |
| 2016 | $1,684 | $76,978 | $17,500 | $59,478 |
| 2015 | $1,680 | $63,312 | $15,750 | $47,562 |
| 2014 | $1,631 | $56,155 | $12,250 | $43,905 |
Source: Public Records
Map
Nearby Homes
- 222 Hollyfern St
- 2707 Fan Palm Ct
- 207 Charter Oak St
- 2544 Wellworth Ave
- 2606 Heartland Ave
- 2544 Kinnard Ave
- 2704 Coventry Green Ave
- 2535 Wellworth Ave
- 2766 Chokecherry Ave
- 2732 Pinewood Ave
- 259 Bonnie Claire Ct
- 2685 Mallard Landing Ave
- 2534 Los Coches Cir
- 240 Highgate St
- 216 Highgate St
- 2743 Woodbine Ave
- 2516 Chenault Cir
- 264 Via Contata St
- 212 Malcolm St
- 2766 Red Vista Ct
- 2700 Balsam Pear Ct
- 2704 Balsam Pear Ct
- 2703 African Violet Ave
- 2701 African Violet Ave
- 2705 African Violet Ave
- 2698 Balsam Pear Ct
- 2706 Balsam Pear Ct
- 2703 Balsam Pear Ct
- 2699 African Violet Ave
- 2707 African Violet Ave
- 2701 Balsam Pear Ct
- 2705 Balsam Pear Ct
- 2696 Balsam Pear Ct
- 2699 Balsam Pear Ct
- 2707 Balsam Pear Ct
- 2697 African Violet Ave
- 2697 Balsam Pear Ct
- 2697 Balsam Pear Ct Unit HOME
- 2702 Pala Dura Dr
- 2702 African Violet Ave