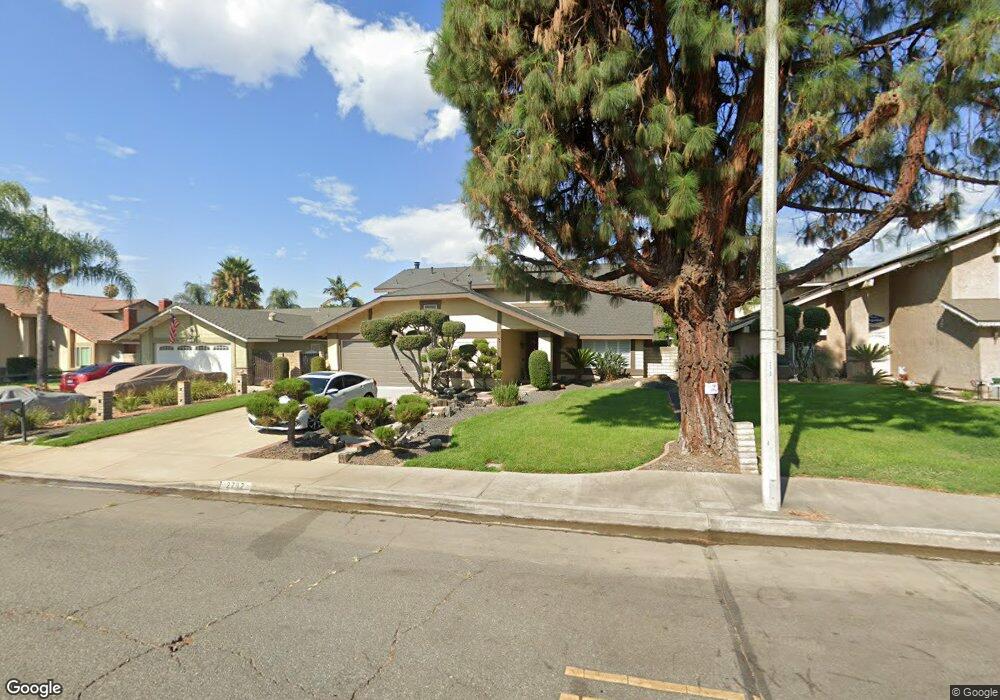
2702 S Cucamonga Ave Ontario, CA 91761
Ontario Ranch NeighborhoodEstimated Value: $754,000 - $807,000
3
Beds
3
Baths
1,969
Sq Ft
$397/Sq Ft
Est. Value
About This Home
This home is located at 2702 S Cucamonga Ave, Ontario, CA 91761 and is currently estimated at $781,143, approximately $396 per square foot. 2702 S Cucamonga Ave is a home located in San Bernardino County with nearby schools including Liberty Elementary School, Woodcrest Junior High, and Chino High School.
Ownership History
Date
Name
Owned For
Owner Type
Purchase Details
Closed on
Mar 6, 2015
Sold by
Chavez Mario
Bought by
Campos Juan R and Chavez Julia
Current Estimated Value
Home Financials for this Owner
Home Financials are based on the most recent Mortgage that was taken out on this home.
Original Mortgage
$289,987
Outstanding Balance
$222,755
Interest Rate
3.76%
Mortgage Type
FHA
Estimated Equity
$558,388
Purchase Details
Closed on
May 21, 2013
Sold by
Chavez Mario
Bought by
Chavez Mario and Chavez Onecimo
Purchase Details
Closed on
Mar 30, 2011
Sold by
Huggins Lloyd
Bought by
Chavez Mario and Chavez Onecimo
Home Financials for this Owner
Home Financials are based on the most recent Mortgage that was taken out on this home.
Original Mortgage
$248,535
Interest Rate
4.25%
Mortgage Type
FHA
Purchase Details
Closed on
May 6, 1998
Sold by
Vander Veen Frank K and Vander Joyce K
Bought by
Huggins Lloyd and Huggins Cecelia
Home Financials for this Owner
Home Financials are based on the most recent Mortgage that was taken out on this home.
Original Mortgage
$138,000
Interest Rate
10%
Create a Home Valuation Report for This Property
The Home Valuation Report is an in-depth analysis detailing your home's value as well as a comparison with similar homes in the area
Home Values in the Area
Average Home Value in this Area
Purchase History
| Date | Buyer | Sale Price | Title Company |
|---|---|---|---|
| Campos Juan R | -- | Pacific Coast Title | |
| Chavez Mario | -- | None Available | |
| Chavez Mario | $255,000 | Chicago Title Company | |
| Huggins Lloyd | $172,500 | Fidelity National Title |
Source: Public Records
Mortgage History
| Date | Status | Borrower | Loan Amount |
|---|---|---|---|
| Open | Campos Juan R | $289,987 | |
| Closed | Chavez Mario | $248,535 | |
| Previous Owner | Huggins Lloyd | $138,000 |
Source: Public Records
Tax History Compared to Growth
Tax History
| Year | Tax Paid | Tax Assessment Tax Assessment Total Assessment is a certain percentage of the fair market value that is determined by local assessors to be the total taxable value of land and additions on the property. | Land | Improvement |
|---|---|---|---|---|
| 2025 | $4,560 | $422,973 | $147,879 | $275,094 |
| 2024 | $4,560 | $414,679 | $144,979 | $269,700 |
| 2023 | $4,434 | $406,548 | $142,136 | $264,412 |
| 2022 | $4,407 | $398,576 | $139,349 | $259,227 |
| 2021 | $4,320 | $390,761 | $136,617 | $254,144 |
| 2020 | $4,264 | $386,754 | $135,216 | $251,538 |
| 2019 | $4,189 | $379,171 | $132,565 | $246,606 |
| 2018 | $4,096 | $371,737 | $129,966 | $241,771 |
| 2017 | $4,022 | $364,448 | $127,418 | $237,030 |
| 2016 | $3,760 | $357,302 | $124,920 | $232,382 |
| 2015 | $2,918 | $271,832 | $95,142 | $176,690 |
| 2014 | $2,862 | $266,507 | $93,278 | $173,229 |
Source: Public Records
Map
Nearby Homes
- 1020 E Tam o Shanter Ct
- 2708 S Parkside Dr
- 2453 S Marigold Place
- 2437 S Garfield Place
- 2919 S Caldwell Ave
- 4235 S Gasly Paseo
- 0 Vineyard Unit CV25067044
- 4245 S Grasly Paseo
- 4233 S Grasly Paseo
- 0 Phillips Unit CV23180894
- 2408 S Taylor Place
- 2413 S Parco Ave
- 2535 S Imperial Place
- 2424 S Lake Ave
- 2817 S Lassen Ave
- 513 E Fairfield Ct
- 1456 E Philadelphia St Unit 134
- 1456 E Philadelphia St Unit 378
- 1456 E Philadelphia St
- 1456 E Philadelphia St Unit 279
- 2708 S Cucamonga Ave
- 2656 S Cucamonga Ave
- 2651 S Holmes Ave
- 2650 S Cucamonga Ave
- 2714 S Cucamonga Ave
- 2703 S Holmes Ave
- 2645 S Holmes Ave
- 2709 S Holmes Ave
- 2639 S Holmes Ave
- 2644 S Cucamonga Ave
- 2720 S Cucamonga Ave
- 2655 S Cucamonga Ave
- 2701 S Cucamonga Ave
- 2649 S Cucamonga Ave
- 2707 S Cucamonga Ave
- 2715 S Holmes Ave
- 2633 S Holmes Ave
- 2643 S Cucamonga Ave
- 2638 S Cucamonga Ave
- 2726 S Cucamonga Ave