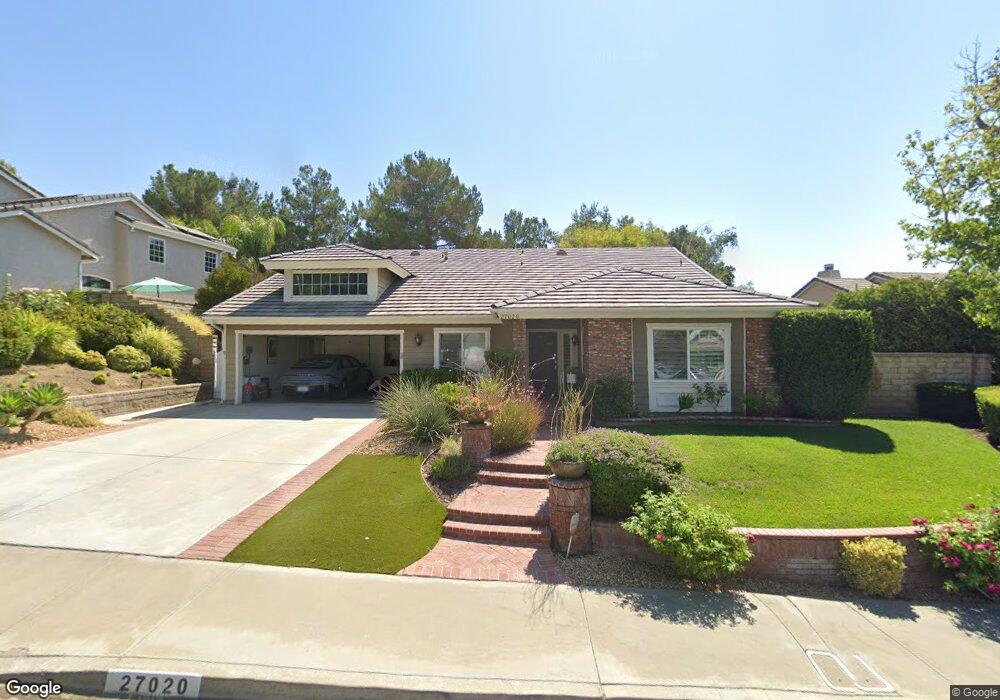
27020 Littlefield Dr Valencia, CA 91354
Estimated Value: $883,926 - $1,181,000
3
Beds
3
Baths
2,137
Sq Ft
$473/Sq Ft
Est. Value
About This Home
This home is located at 27020 Littlefield Dr, Valencia, CA 91354 and is currently estimated at $1,009,982, approximately $472 per square foot. 27020 Littlefield Dr is a home located in Los Angeles County with nearby schools including Charles Helmers Elementary School, Rio Norte Junior High School, and Valencia High School.
Ownership History
Date
Name
Owned For
Owner Type
Purchase Details
Closed on
Jun 22, 2011
Sold by
Weible David Lee and Weible Laura Faraci
Bought by
Weible Laura Faraci and Faraci Weible Trust
Current Estimated Value
Home Financials for this Owner
Home Financials are based on the most recent Mortgage that was taken out on this home.
Original Mortgage
$271,000
Outstanding Balance
$185,443
Interest Rate
4.55%
Mortgage Type
New Conventional
Estimated Equity
$824,539
Purchase Details
Closed on
Feb 11, 2009
Sold by
Weible David L and Weible Laura Faraci
Bought by
Weible David Lee and Weible Laura Faraci
Purchase Details
Closed on
Aug 5, 1997
Sold by
Margiotta Grace Margiotta, Robert and Margiotta Ruffinelli
Bought by
Weible David L and Weible Laura Faraci
Home Financials for this Owner
Home Financials are based on the most recent Mortgage that was taken out on this home.
Original Mortgage
$212,000
Interest Rate
7.62%
Create a Home Valuation Report for This Property
The Home Valuation Report is an in-depth analysis detailing your home's value as well as a comparison with similar homes in the area
Home Values in the Area
Average Home Value in this Area
Purchase History
| Date | Buyer | Sale Price | Title Company |
|---|---|---|---|
| Weible Laura Faraci | -- | First American Title Company | |
| Weible David Lee | -- | None Available | |
| Weible David L | $265,000 | Investors Title Company |
Source: Public Records
Mortgage History
| Date | Status | Borrower | Loan Amount |
|---|---|---|---|
| Open | Weible Laura Faraci | $271,000 | |
| Closed | Weible David L | $212,000 |
Source: Public Records
Tax History Compared to Growth
Tax History
| Year | Tax Paid | Tax Assessment Tax Assessment Total Assessment is a certain percentage of the fair market value that is determined by local assessors to be the total taxable value of land and additions on the property. | Land | Improvement |
|---|---|---|---|---|
| 2025 | $7,131 | $423,116 | $142,895 | $280,221 |
| 2024 | $6,852 | $414,821 | $140,094 | $274,727 |
| 2023 | $6,658 | $406,689 | $137,348 | $269,341 |
| 2022 | $6,654 | $398,715 | $134,655 | $264,060 |
| 2021 | $6,452 | $390,898 | $132,015 | $258,883 |
| 2020 | $6,313 | $386,891 | $130,662 | $256,229 |
| 2019 | $6,175 | $379,305 | $128,100 | $251,205 |
| 2018 | $5,995 | $371,869 | $125,589 | $246,280 |
| 2016 | $5,576 | $357,430 | $120,713 | $236,717 |
| 2015 | $5,395 | $352,062 | $118,900 | $233,162 |
| 2014 | $5,386 | $345,166 | $116,571 | $228,595 |
Source: Public Records
Map
Nearby Homes
- 26967 Hillsborough Pkwy Unit 77
- 26951 Hillsborough Pkwy Unit 47
- 26963 Hillsborough Pkwy Unit 71
- 23633 Big Sky Walk Unit 129
- 23612 Muir Trail Unit 74
- 27100 Sanford Way
- 27017 Big Rapids Unit 37
- 26841 Shorebreak Ln Unit 35
- 23402 Brookdale Ln Unit 56
- 23321 Beachcomber Ln
- 23141 La Granja Dr
- 23054 La Granja Dr
- 27104 Breakers Cove
- 27217 Branbury Ct
- 27139 Vista Encantada Dr
- 23916 Windward Ln
- 23371 Camford Place
- 26502 Rock Creek Dr
- 27358 Brighton Ln
- 23609 Wilmington Ct
- 27010 Littlefield Dr
- 27030 Littlefield Dr
- 27011 Benton Ct
- 27036 Littlefield Dr
- 27009 Benton Ct
- 27015 Littlefield Dr
- 27013 Benton Ct
- 23445 Riversbridge Way
- 27023 Littlefield Dr
- 23449 Riversbridge Way
- 23504 Millston Ct
- 27009 Littlefield Dr
- 27003 Benton Ct
- 27017 Benton Ct
- 27042 Littlefield Dr
- 23459 Riversbridge Way
- 23510 Millston Ct
- 23463 Riversbridge Way
- 27021 Benton Ct
- 27046 Littlefield Dr