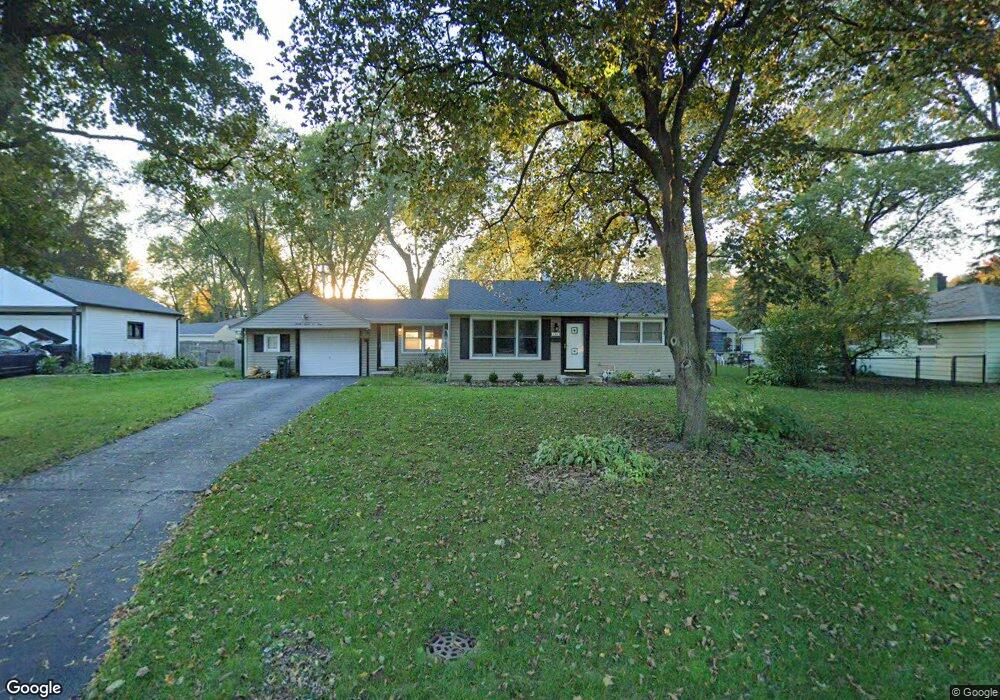
2703 Dove St Rolling Meadows, IL 60008
Estimated Value: $268,000 - $323,000
2
Beds
1
Bath
861
Sq Ft
$336/Sq Ft
Est. Value
About This Home
This home is located at 2703 Dove St, Rolling Meadows, IL 60008 and is currently estimated at $289,438, approximately $336 per square foot. 2703 Dove St is a home located in Cook County with nearby schools including Kimball Hill Elementary School, Carl Sandburg Junior High School, and Rolling Meadows High School.
Ownership History
Date
Name
Owned For
Owner Type
Purchase Details
Closed on
Oct 25, 2004
Sold by
Johansson Erik I and Johansson Renee G
Bought by
Schneider Susan
Current Estimated Value
Home Financials for this Owner
Home Financials are based on the most recent Mortgage that was taken out on this home.
Original Mortgage
$184,000
Outstanding Balance
$89,688
Interest Rate
5.85%
Mortgage Type
Unknown
Estimated Equity
$199,750
Purchase Details
Closed on
Oct 18, 2001
Sold by
Brencick Vincent A
Bought by
Johansson Erik I and Johansson Renee G
Home Financials for this Owner
Home Financials are based on the most recent Mortgage that was taken out on this home.
Original Mortgage
$173,400
Interest Rate
6.72%
Mortgage Type
VA
Purchase Details
Closed on
Jul 27, 2001
Sold by
Brencick Kathryn L
Bought by
Brencick Vincent A
Create a Home Valuation Report for This Property
The Home Valuation Report is an in-depth analysis detailing your home's value as well as a comparison with similar homes in the area
Home Values in the Area
Average Home Value in this Area
Purchase History
| Date | Buyer | Sale Price | Title Company |
|---|---|---|---|
| Schneider Susan | $230,000 | Multiple | |
| Johansson Erik I | $170,000 | -- | |
| Brencick Vincent A | -- | -- |
Source: Public Records
Mortgage History
| Date | Status | Borrower | Loan Amount |
|---|---|---|---|
| Open | Schneider Susan | $184,000 | |
| Previous Owner | Johansson Erik I | $173,400 |
Source: Public Records
Tax History
| Year | Tax Paid | Tax Assessment Tax Assessment Total Assessment is a certain percentage of the fair market value that is determined by local assessors to be the total taxable value of land and additions on the property. | Land | Improvement |
|---|---|---|---|---|
| 2025 | $5,397 | $24,000 | $6,513 | $17,487 |
| 2024 | $5,397 | $20,002 | $5,511 | $14,491 |
| 2023 | $5,466 | $22,042 | $5,511 | $16,531 |
| 2022 | $5,466 | $22,042 | $5,511 | $16,531 |
| 2021 | $4,302 | $16,322 | $3,256 | $13,066 |
| 2020 | $4,275 | $16,322 | $3,256 | $13,066 |
| 2019 | $4,308 | $18,237 | $3,256 | $14,981 |
| 2018 | $3,977 | $15,714 | $3,006 | $12,708 |
| 2017 | $3,915 | $15,714 | $3,006 | $12,708 |
| 2016 | $4,274 | $16,957 | $3,006 | $13,951 |
| 2015 | $3,881 | $14,950 | $2,755 | $12,195 |
| 2014 | $3,805 | $14,950 | $2,755 | $12,195 |
| 2013 | $3,696 | $14,950 | $2,755 | $12,195 |
Source: Public Records
Map
Nearby Homes
- 2308 Park St
- 2201 Kingfisher Ln
- 2705 Park St
- 1505 W Euclid Ave
- 2709 Lily Ln
- 3209 Trillium Cir
- 3306 Trillium Cir Unit 3001
- 3605 Oriole Ln
- 3100 Town Square Dr Unit 308
- 3100 Town Square Dr Unit 204
- 3135 Town Square Dr Unit 401
- 3135 Town Square Dr Unit 104
- 2814 Cardinal Dr
- 3712 Jay Ln
- 1107 W Francis Dr
- 516-20 W Wing St
- 3265 Kirchoff Rd Unit 116
- 3200 Thrush Ln
- 912 N Chicago Ave
- 2302 Fulle St
- 2101 Sigwalt St
- 2705 Dove St Unit 1
- 2103 Sigwalt St
- 2102 George St
- 2100 George St Unit 1
- 2105 Sigwalt St
- 2104 George St
- 2706 Dove St
- 2704 Dove St
- 2708 Dove St
- 2100 Sigwalt St
- 2702 Dove St
- 2106 George St
- 2710 Dove St
- 2107 Sigwalt St
- 2700 Dove St
- 2712 Dove St
- 2102 Sigwalt St
- 2608 Dove St
- 2200 George St
Your Personal Tour Guide
Ask me questions while you tour the home.