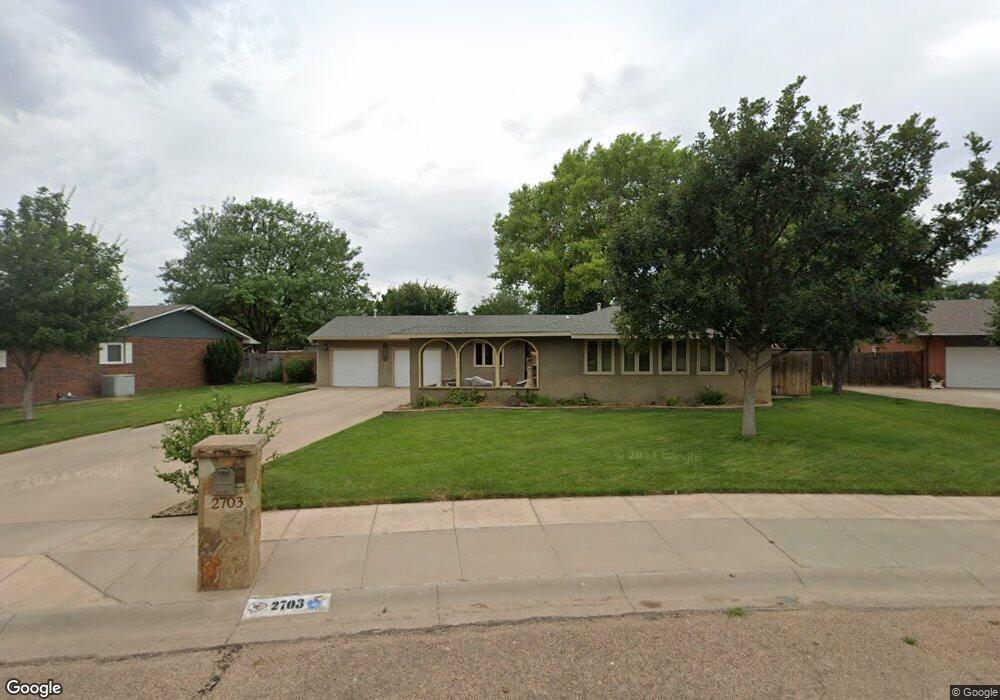
2703 N Rowland Rd Garden City, KS 67846
Estimated Value: $354,393 - $420,000
5
Beds
4
Baths
1,588
Sq Ft
$244/Sq Ft
Est. Value
About This Home
This home is located at 2703 N Rowland Rd, Garden City, KS 67846 and is currently estimated at $387,598, approximately $244 per square foot. 2703 N Rowland Rd is a home located in Finney County with nearby schools including Florence Wilson Elementary School, Kenneth Henderson Middle School, and Bernadine Sitts Intermediate Center.
Ownership History
Date
Name
Owned For
Owner Type
Purchase Details
Closed on
May 24, 2013
Sold by
Maestas Peter A and Maestas Kathryn J
Bought by
Lucas Randy J and Lucas Jill A
Current Estimated Value
Home Financials for this Owner
Home Financials are based on the most recent Mortgage that was taken out on this home.
Original Mortgage
$228,000
Outstanding Balance
$161,199
Interest Rate
3.43%
Mortgage Type
New Conventional
Estimated Equity
$226,399
Purchase Details
Closed on
May 20, 2010
Sold by
Maestas Pete A and Maestas Kathryn J
Bought by
Peter A Maestas Trust and Kathryn J Maestas Trust
Purchase Details
Closed on
Jan 8, 2010
Sold by
Pearson Jackie
Bought by
Maestas Pete A and Maestas Kathryn J
Home Financials for this Owner
Home Financials are based on the most recent Mortgage that was taken out on this home.
Original Mortgage
$144,000
Interest Rate
4.8%
Mortgage Type
New Conventional
Create a Home Valuation Report for This Property
The Home Valuation Report is an in-depth analysis detailing your home's value as well as a comparison with similar homes in the area
Home Values in the Area
Average Home Value in this Area
Purchase History
| Date | Buyer | Sale Price | Title Company |
|---|---|---|---|
| Lucas Randy J | -- | None Available | |
| Peter A Maestas Trust | -- | None Available | |
| Maestas Pete A | -- | None Available |
Source: Public Records
Mortgage History
| Date | Status | Borrower | Loan Amount |
|---|---|---|---|
| Open | Lucas Randy J | $228,000 | |
| Previous Owner | Maestas Pete A | $144,000 |
Source: Public Records
Tax History Compared to Growth
Tax History
| Year | Tax Paid | Tax Assessment Tax Assessment Total Assessment is a certain percentage of the fair market value that is determined by local assessors to be the total taxable value of land and additions on the property. | Land | Improvement |
|---|---|---|---|---|
| 2024 | $7,191 | $43,706 | $2,719 | $40,987 |
| 2023 | $7,191 | $39,583 | $2,446 | $37,137 |
| 2022 | $5,847 | $35,985 | $2,177 | $33,808 |
| 2021 | $5,412 | $33,011 | $2,177 | $30,834 |
| 2020 | $5,077 | $31,533 | $2,177 | $29,356 |
| 2019 | $5,018 | $31,738 | $2,177 | $29,561 |
| 2018 | $4,754 | $30,212 | $1,962 | $28,250 |
| 2017 | $4,592 | $0 | $0 | $0 |
| 2016 | $4,449 | $0 | $0 | $0 |
| 2015 | $4,031 | $0 | $0 | $0 |
| 2012 | -- | $0 | $0 | $0 |
Source: Public Records
Map
Nearby Homes
- 2617 N Coachman Ln
- 2065 Cottontail Ct
- 2075 Cottontail Ct
- 2090 Cottontail Ct
- 2055 Cottontail Ct
- 2085 Cottontail Ct
- 2095 Cottontail Ct
- 2060 Cottontail Ct
- 2505 N Carriage Ln
- 1101 E Mary St
- 2504 N Carriage Ln
- 2808 N Broadmoor Place
- 2402 N Koster St
- 624 Briar Hill Dr
- 1810 N Koster St
- 2106 N Belmont Place Unit 4
- 807 E Price St
- 2008 N Antler Ridge Dr
- 2614 N 7th St
- 2010 N Belmont Place
- 2701 N Rowland Rd
- 2705 N Rowland Rd
- 2704 N Easy St
- 2706 N Easy St
- 2702 N Easy St
- 2708 N Rowland Rd
- 2904 N Rowland Rd
- 2908 N Rowland Rd
- 2906 N Rowland Rd
- 2702 N Rowland Rd
- 2709 N Rowland Rd
- 2708 N Easy St
- 1402 E Labrador Blvd
- 1404 E Labrador Blvd
- 1306 E Labrador Blvd
- 1504 N Rowland Rd
- 2621 N Rowland Rd
- 2711 N Rowland Rd
- 1503 E Labrador Blvd
- 1304 E Labrador Blvd