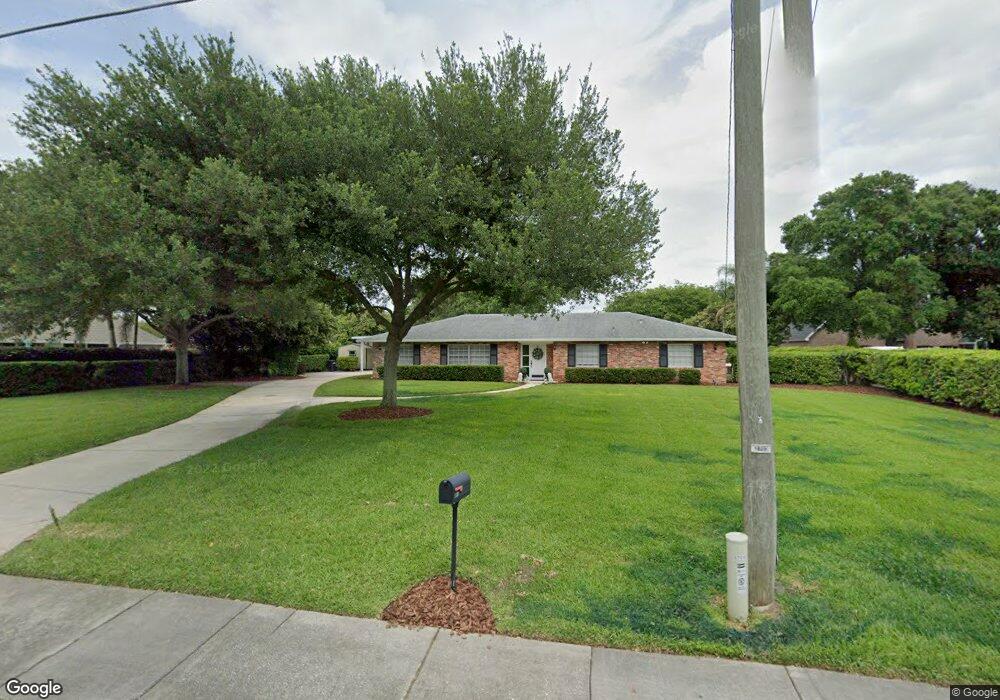
2703 Pershing Ave Orlando, FL 32806
Conway NeighborhoodEstimated Value: $638,741 - $822,000
4
Beds
3
Baths
2,704
Sq Ft
$263/Sq Ft
Est. Value
About This Home
This home is located at 2703 Pershing Ave, Orlando, FL 32806 and is currently estimated at $710,685, approximately $262 per square foot. 2703 Pershing Ave is a home located in Orange County with nearby schools including Pershing Elementary School, Boone High School, and Cornerstone Charter Academy High School.
Ownership History
Date
Name
Owned For
Owner Type
Purchase Details
Closed on
May 21, 2019
Sold by
Weber Richard Dean and Weber Nancy Dallene
Bought by
Lachapelle Justin David and Lachapelle Kristin Anne
Current Estimated Value
Home Financials for this Owner
Home Financials are based on the most recent Mortgage that was taken out on this home.
Original Mortgage
$332,000
Interest Rate
3.8%
Mortgage Type
New Conventional
Purchase Details
Closed on
Jul 31, 2018
Sold by
Herbeck Sadle G
Bought by
Weber Richard Dean and Weber Nancy Dallene
Home Financials for this Owner
Home Financials are based on the most recent Mortgage that was taken out on this home.
Original Mortgage
$250,000
Interest Rate
6.62%
Mortgage Type
Adjustable Rate Mortgage/ARM
Purchase Details
Closed on
Aug 2, 2007
Sold by
Herbeck Allen E and Herbeck Sadie G
Bought by
Herbeck Allen E and Herbeck Sadie G
Create a Home Valuation Report for This Property
The Home Valuation Report is an in-depth analysis detailing your home's value as well as a comparison with similar homes in the area
Home Values in the Area
Average Home Value in this Area
Purchase History
| Date | Buyer | Sale Price | Title Company |
|---|---|---|---|
| Lachapelle Justin David | $415,000 | Terra Title Of Florida Llc | |
| Weber Richard Dean | $365,000 | None Available | |
| Herbeck Allen E | -- | Attorney |
Source: Public Records
Mortgage History
| Date | Status | Borrower | Loan Amount |
|---|---|---|---|
| Previous Owner | Lachapelle Justin David | $332,000 | |
| Previous Owner | Weber Richard Dean | $250,000 |
Source: Public Records
Tax History
| Year | Tax Paid | Tax Assessment Tax Assessment Total Assessment is a certain percentage of the fair market value that is determined by local assessors to be the total taxable value of land and additions on the property. | Land | Improvement |
|---|---|---|---|---|
| 2025 | $5,599 | $374,164 | -- | -- |
| 2024 | $4,981 | $363,619 | -- | -- |
| 2023 | $4,981 | $343,079 | $0 | $0 |
| 2022 | $4,814 | $333,086 | $0 | $0 |
| 2021 | $4,742 | $323,384 | $0 | $0 |
| 2020 | $4,516 | $318,919 | $0 | $0 |
| 2019 | $5,456 | $322,411 | $95,000 | $227,411 |
| 2018 | $2,564 | $181,074 | $0 | $0 |
| 2017 | $2,521 | $246,429 | $80,000 | $166,429 |
| 2016 | $2,493 | $244,245 | $80,000 | $164,245 |
| 2015 | $2,534 | $235,729 | $80,000 | $155,729 |
| 2014 | $2,584 | $191,258 | $80,000 | $111,258 |
Source: Public Records
Map
Nearby Homes
- 3911 Venice Dr
- 2813 Timberlake Dr
- 2420 Pershing Ave
- 3606 S Forest St
- 3503 S Crystal Lake Dr
- 4311 Waterfront Pkwy
- 3218 Carnine Dr
- 1903 Simonton Ave
- 1905 Pershing Ave
- 1914 Geigel Ave
- 3400 Charow Ln
- 2408 Lake Margaret Dr
- 2411 Lake Margaret Dr
- 2598 Sheffield Ave
- 1892 White Ave
- 1920 Baxter Ave
- 3105 S Crystal Lake Dr
- 4836 Big Oaks Ln
- 4512 Crichton Ln
- 3320 Conway Gardens Rd
- 2715 Pershing Ave
- 2535 Pershing Oaks Place
- 2543 Pershing Oaks Place
- 2527 Pershing Oaks Place
- 2618 Timberlake Dr
- 2612 Timberlake Dr
- 2624 Timberlake Dr
- 3616 Devonswood Dr
- 3610 Devonswood Dr
- 2610 Pershing Ave
- 2628 Pershing Ave
- 3622 Devonswood Dr
- 2606 Timberlake Dr
- 2700 Timberlake Dr
- 3604 Devonswood Dr
- 2519 Pershing Oaks Place
- 2520 Pershing Oaks Place
- 3524 Devonswood Dr
- 2600 Timberlake Dr
- 2530 Pershing Ave
Your Personal Tour Guide
Ask me questions while you tour the home.