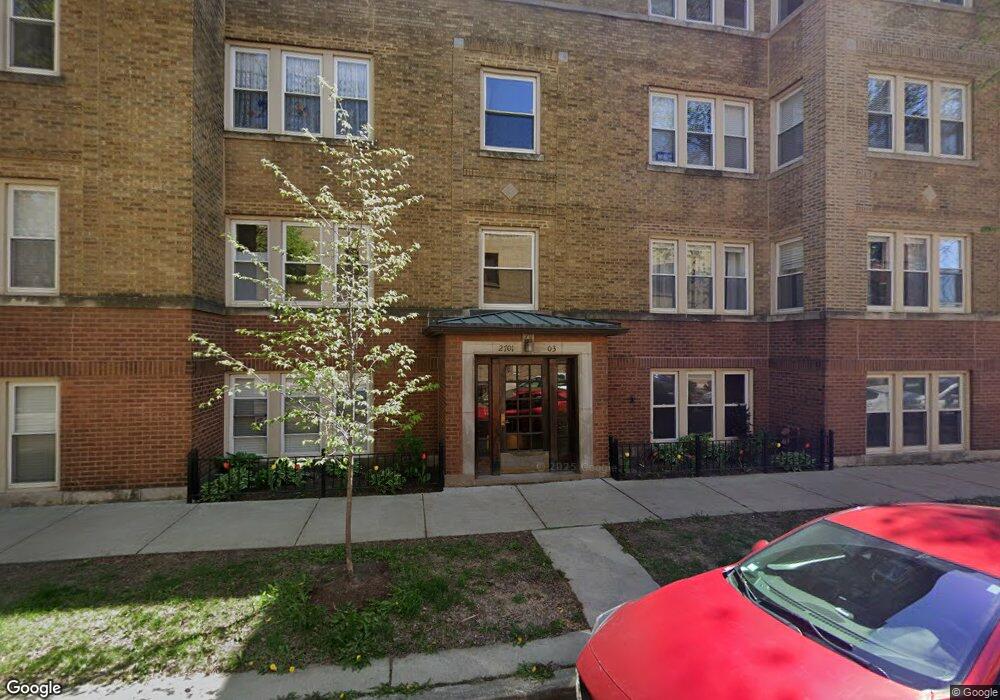
2703 W Ainslie St Unit 27032 Chicago, IL 60625
Lincoln Square NeighborhoodEstimated Value: $228,101 - $322,000
1
Bed
1
Bath
900
Sq Ft
$309/Sq Ft
Est. Value
About This Home
This home is located at 2703 W Ainslie St Unit 27032, Chicago, IL 60625 and is currently estimated at $278,025, approximately $308 per square foot. 2703 W Ainslie St Unit 27032 is a home located in Cook County with nearby schools including Budlong Elementary School, Amundsen High School, and North Shore Adventist Academy.
Ownership History
Date
Name
Owned For
Owner Type
Purchase Details
Closed on
Sep 20, 2017
Sold by
Link Grant M
Bought by
Elias Pushett Raya and Elias Ellen
Current Estimated Value
Purchase Details
Closed on
May 24, 2008
Sold by
Mader Colleen
Bought by
Link Grant
Home Financials for this Owner
Home Financials are based on the most recent Mortgage that was taken out on this home.
Original Mortgage
$176,800
Interest Rate
6.04%
Mortgage Type
Unknown
Purchase Details
Closed on
Apr 12, 2004
Sold by
Barr Brenda G
Bought by
Mader Colleen
Home Financials for this Owner
Home Financials are based on the most recent Mortgage that was taken out on this home.
Original Mortgage
$170,000
Interest Rate
4.12%
Mortgage Type
Unknown
Purchase Details
Closed on
May 25, 1999
Sold by
Ainslie Partners
Bought by
Barr Brenda G
Home Financials for this Owner
Home Financials are based on the most recent Mortgage that was taken out on this home.
Original Mortgage
$79,958
Interest Rate
7.12%
Create a Home Valuation Report for This Property
The Home Valuation Report is an in-depth analysis detailing your home's value as well as a comparison with similar homes in the area
Home Values in the Area
Average Home Value in this Area
Purchase History
| Date | Buyer | Sale Price | Title Company |
|---|---|---|---|
| Elias Pushett Raya | $210,000 | Fidelity National Title | |
| Link Grant | $221,000 | Premier Title | |
| Mader Colleen | $185,000 | Lawyers | |
| Barr Brenda G | $95,500 | -- |
Source: Public Records
Mortgage History
| Date | Status | Borrower | Loan Amount |
|---|---|---|---|
| Previous Owner | Link Grant | $176,800 | |
| Previous Owner | Mader Colleen | $170,000 | |
| Previous Owner | Barr Brenda G | $79,958 |
Source: Public Records
Tax History Compared to Growth
Tax History
| Year | Tax Paid | Tax Assessment Tax Assessment Total Assessment is a certain percentage of the fair market value that is determined by local assessors to be the total taxable value of land and additions on the property. | Land | Improvement |
|---|---|---|---|---|
| 2024 | $2,887 | $19,238 | $1,398 | $17,840 |
| 2023 | $2,793 | $17,000 | $945 | $16,055 |
| 2022 | $2,793 | $17,000 | $945 | $16,055 |
| 2021 | $2,749 | $16,999 | $945 | $16,054 |
| 2020 | $2,843 | $15,864 | $945 | $14,919 |
| 2019 | $2,827 | $17,500 | $945 | $16,555 |
| 2018 | $2,778 | $17,500 | $945 | $16,555 |
| 2017 | $2,844 | $16,589 | $827 | $15,762 |
| 2016 | $2,822 | $16,589 | $827 | $15,762 |
| 2015 | $2,559 | $16,589 | $827 | $15,762 |
| 2014 | $2,861 | $17,991 | $767 | $17,224 |
| 2013 | $2,794 | $17,991 | $767 | $17,224 |
Source: Public Records
Map
Nearby Homes
- 2720 W Gunnison St
- 4850 N Rockwell St
- 2709 W Lawrence Ave Unit 3
- 4755 N Washtenaw Ave Unit P-27
- 4755 N Washtenaw Ave Unit P-25
- 4755 N Washtenaw Ave Unit P-11
- 2754 W Giddings St
- 4946 N Mozart St
- 2607 W Carmen Ave
- 2527 W Argyle St
- 2700 W Carmen Ave
- 2522 W Winnemac Ave
- 2524 W Winnemac Ave
- 2617 W Leland Ave Unit 1
- 2505 W Carmen Ave Unit 303
- 2540 W Leland Ave Unit 2
- 5061 N Lincoln Ave Unit 201
- 2601 W Foster Ave Unit 3S
- 4950 N Western Ave Unit 5H
- 4751 N Artesian Ave Unit 205
- 2703 W Ainslie St Unit 27031
- 2703 W Ainslie St Unit 27033
- 2703 W Ainslie St
- 2703 W Ainslie St Unit 2
- 2703 W Ainslie St Unit 1
- 2705 W Ainslie St Unit 27052
- 2705 W Ainslie St Unit 27053
- 2705 W Ainslie St Unit 27051
- 2705 W Ainslie St Unit 1s
- 2705 W Ainslie St
- 2705 W Ainslie St Unit 2
- 2705 W Ainslie St Unit 3
- 4866 N Washtenaw Ave
- 4866 N Washtenaw Ave Unit M06B
- 4866 N Washtenaw Ave
- 4866 N Washtenaw Ave
- 4866 N Washtenaw Ave Unit 2
- 2707 W Ainslie St Unit 27072
- 2701 W Ainslie St Unit 27012
- 2707 W Ainslie St Unit 27071