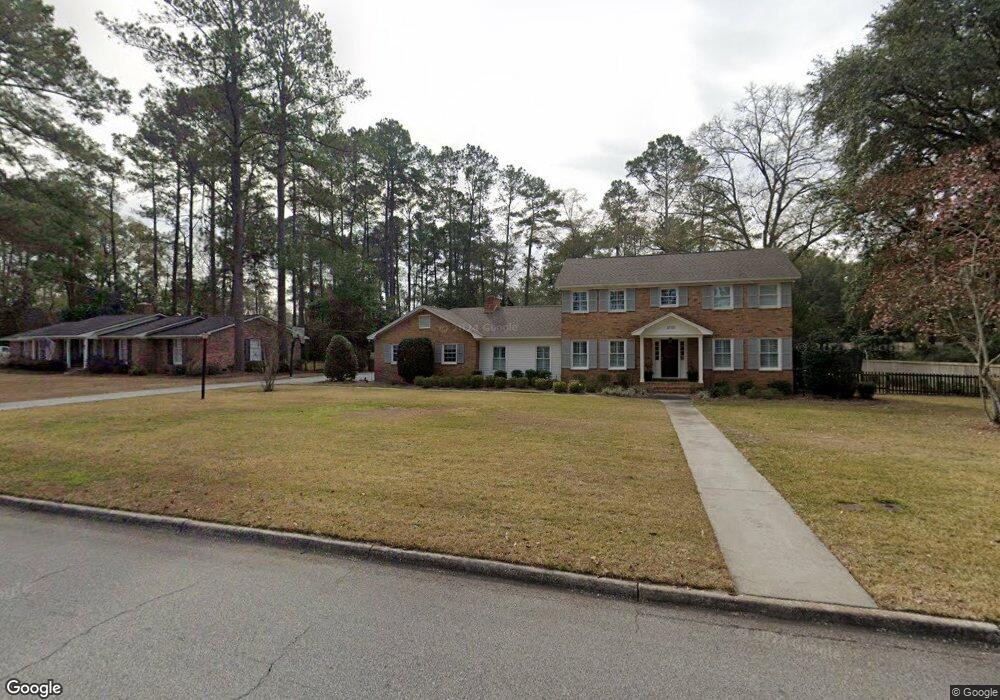
2703 Winding Way Valdosta, GA 31602
Estimated Value: $343,000 - $400,000
4
Beds
3
Baths
2,290
Sq Ft
$160/Sq Ft
Est. Value
About This Home
This home is located at 2703 Winding Way, Valdosta, GA 31602 and is currently estimated at $367,428, approximately $160 per square foot. 2703 Winding Way is a home located in Lowndes County with nearby schools including S.L. Mason Elementary School, Valdosta Middle School, and Valdosta High School.
Ownership History
Date
Name
Owned For
Owner Type
Purchase Details
Closed on
Oct 24, 2012
Sold by
Deal Alysha
Bought by
Deal Alysha and Deal Bryan J
Current Estimated Value
Home Financials for this Owner
Home Financials are based on the most recent Mortgage that was taken out on this home.
Original Mortgage
$247,000
Outstanding Balance
$42,286
Interest Rate
2.76%
Mortgage Type
New Conventional
Estimated Equity
$325,142
Purchase Details
Closed on
Apr 17, 2012
Sold by
Henderson Amy Funderburk
Bought by
Funderburk John C and Henderson Amy Elaine Funderbu
Home Financials for this Owner
Home Financials are based on the most recent Mortgage that was taken out on this home.
Original Mortgage
$250,000
Interest Rate
4.13%
Mortgage Type
New Conventional
Purchase Details
Closed on
Oct 22, 1971
Bought by
Funderburk John and Funderburk Franc
Purchase Details
Closed on
Sep 10, 1965
Bought by
Buchwald Randolph L
Create a Home Valuation Report for This Property
The Home Valuation Report is an in-depth analysis detailing your home's value as well as a comparison with similar homes in the area
Home Values in the Area
Average Home Value in this Area
Purchase History
| Date | Buyer | Sale Price | Title Company |
|---|---|---|---|
| Deal Alysha | -- | -- | |
| Funderburk John C | -- | -- | |
| Deal Alysha | $204,900 | -- | |
| Funderburk John | $10,900 | -- | |
| Buchwald Randolph L | -- | -- |
Source: Public Records
Mortgage History
| Date | Status | Borrower | Loan Amount |
|---|---|---|---|
| Open | Deal Alysha | $247,000 | |
| Previous Owner | Deal Alysha | $250,000 |
Source: Public Records
Tax History Compared to Growth
Tax History
| Year | Tax Paid | Tax Assessment Tax Assessment Total Assessment is a certain percentage of the fair market value that is determined by local assessors to be the total taxable value of land and additions on the property. | Land | Improvement |
|---|---|---|---|---|
| 2024 | $6,627 | $148,674 | $24,000 | $124,674 |
| 2023 | $4,152 | $143,914 | $24,000 | $119,914 |
| 2022 | $4,099 | $121,307 | $24,000 | $97,307 |
| 2021 | $4,229 | $121,618 | $24,000 | $97,618 |
| 2020 | $3,589 | $101,049 | $18,000 | $83,049 |
| 2019 | $3,598 | $101,360 | $18,000 | $83,360 |
| 2018 | $2,901 | $80,686 | $18,000 | $62,686 |
| 2017 | $2,921 | $80,686 | $18,000 | $62,686 |
| 2016 | $2,683 | $74,202 | $18,000 | $56,202 |
| 2015 | -- | $74,202 | $18,000 | $56,202 |
| 2014 | $2,504 | $74,202 | $18,000 | $56,202 |
Source: Public Records
Map
Nearby Homes
- 2524 Jerry Jones Dr
- 2517 Rolling Rd
- 3012 Wendover Rd
- 4 Charlcote Cir
- 1113 Clover Hill Rd
- 1112 Lake Dr
- 2826 Bud McKey Cir
- 1114 Lake Dr
- 805 Millpond Rd
- 1100 Ravenwood Cir
- 2446 Meadowbrook Dr
- 7 Winding Cir
- 2905 Pebblewood Dr
- 2909 Pebblewood Dr
- 422 Canna Dr
- 2825 Bud McKey Cir
- 2432 Meadowbrook Dr
- 2502B Jerry Jones Dr Unit 1
- 2416 Westwood Dr
- 1 Fox Hollow Cir
- 2705 Winding Way
- 2701 Winding Way
- 2602 Jerry Jones Dr
- 2600 Jerry Jones Dr
- 2702 Winding Way
- 2700 Winding Way
- 2604 Jerry Jones Dr
- 2604 Jerry Jones Dr Unit 3
- 2611 Winding Way
- 2612 Jerry Jones Dr
- 3004 Country Club Dr
- 3006 Country Club Dr
- 2704 Winding Way
- 3002 Country Club Dr
- 1102 Cold Springs Ln
- 2609 Winding Way
- 2610 Winding Way
- 3008 Country Club Dr
- 3000 Country Club Dr
- 1104 Cold Springs Ln