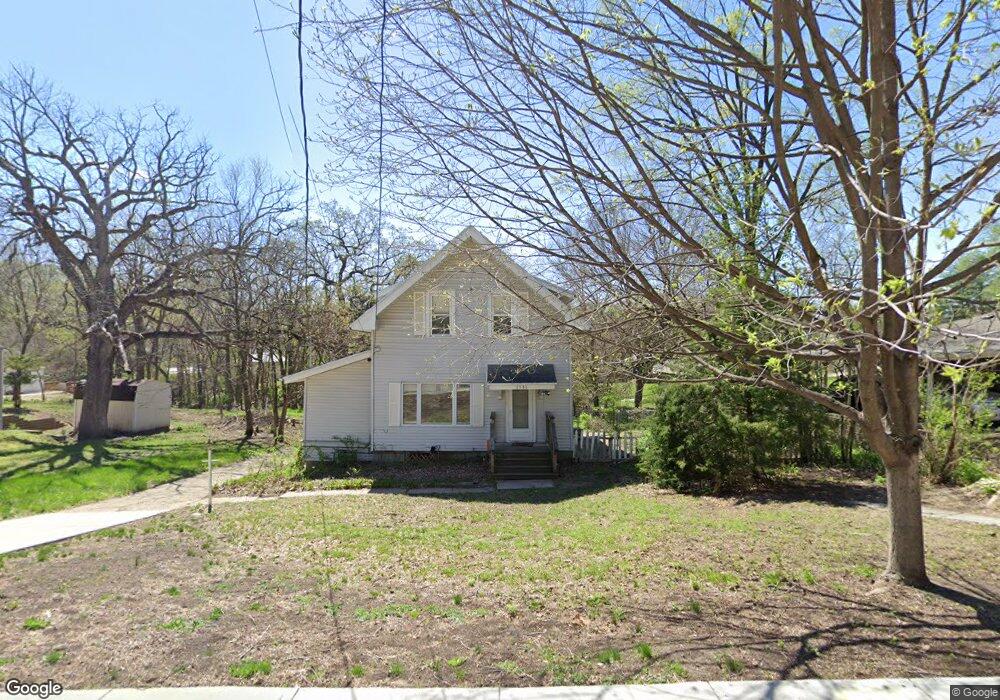
2704 Sheridan Ave Des Moines, IA 50310
Doudna Heights-Glen Oaks NeighborhoodEstimated Value: $182,000 - $224,000
3
Beds
1
Bath
1,355
Sq Ft
$147/Sq Ft
Est. Value
About This Home
This home is located at 2704 Sheridan Ave, Des Moines, IA 50310 and is currently estimated at $199,687, approximately $147 per square foot. 2704 Sheridan Ave is a home located in Polk County with nearby schools including Monroe Elementary School, Meredith Middle School, and Hoover High School.
Ownership History
Date
Name
Owned For
Owner Type
Purchase Details
Closed on
Sep 13, 2005
Sold by
Kurtz Craig A
Bought by
Lynde Leland and Nelson Grotrian Pamela
Current Estimated Value
Home Financials for this Owner
Home Financials are based on the most recent Mortgage that was taken out on this home.
Original Mortgage
$100,000
Interest Rate
5.93%
Mortgage Type
Fannie Mae Freddie Mac
Purchase Details
Closed on
Jul 24, 2002
Sold by
Seery Violet A
Bought by
Harris Tony P and Harris Kristin D
Purchase Details
Closed on
Jun 25, 2001
Sold by
Harris Tony P and Harris Kristin D
Bought by
Kurtz Craig A
Home Financials for this Owner
Home Financials are based on the most recent Mortgage that was taken out on this home.
Original Mortgage
$93,532
Interest Rate
6.4%
Mortgage Type
FHA
Create a Home Valuation Report for This Property
The Home Valuation Report is an in-depth analysis detailing your home's value as well as a comparison with similar homes in the area
Home Values in the Area
Average Home Value in this Area
Purchase History
| Date | Buyer | Sale Price | Title Company |
|---|---|---|---|
| Lynde Leland | $124,500 | -- | |
| Harris Tony P | $42,000 | -- | |
| Kurtz Craig A | $94,500 | -- |
Source: Public Records
Mortgage History
| Date | Status | Borrower | Loan Amount |
|---|---|---|---|
| Previous Owner | Lynde Leland | $100,000 | |
| Previous Owner | Kurtz Craig A | $93,532 |
Source: Public Records
Tax History Compared to Growth
Tax History
| Year | Tax Paid | Tax Assessment Tax Assessment Total Assessment is a certain percentage of the fair market value that is determined by local assessors to be the total taxable value of land and additions on the property. | Land | Improvement |
|---|---|---|---|---|
| 2025 | $2,340 | $140,400 | $50,900 | $89,500 |
| 2024 | $2,340 | $129,400 | $45,800 | $83,600 |
| 2023 | $2,272 | $129,400 | $45,800 | $83,600 |
| 2022 | $2,254 | $105,300 | $38,200 | $67,100 |
| 2021 | $2,138 | $105,300 | $38,200 | $67,100 |
| 2020 | $2,216 | $94,300 | $33,700 | $60,600 |
| 2019 | $2,040 | $94,300 | $33,700 | $60,600 |
| 2018 | $2,014 | $84,400 | $28,500 | $55,900 |
| 2017 | $2,972 | $84,400 | $28,500 | $55,900 |
| 2016 | $2,890 | $118,400 | $27,600 | $90,800 |
| 2015 | $2,890 | $118,400 | $27,600 | $90,800 |
| 2014 | $2,556 | $104,900 | $24,300 | $80,600 |
Source: Public Records
Map
Nearby Homes
- 2730 Sheridan Ave
- 2701 27th St
- 2823 Holcomb Ave
- 2615 30th St
- 2523 Prospect Rd
- 2742 Hickman Rd
- 2620 Arnold Rd
- 2515 24th St
- 2315 Holcomb Ave
- 3109 Holcomb Ave
- 3112 Sheridan Ave
- 2715 Allison Ave
- 2513 33rd St
- 2516 Boston Ave
- 2413 Adams Ave
- 2804 Boston Ave
- 2104 23rd St
- 00 24th St
- 3111 Lincoln Ave
- 3016 30th St
- 2716 Sheridan Ave
- 2700 Sheridan Ave
- 2700 27th St
- 2611 27th Place
- 2706 27th St
- 2624 Sheridan Ave
- 2722 Sheridan Ave
- 2719 Sheridan Ave
- 2712 27th St
- 2607 27th Place
- 2721 Sheridan Ave
- 2614 Sheridan Ave
- 2626 Prospect Rd
- 2617 Sheridan Ave
- 2526 27th St
- 2616 27th Place
- 2728 Sheridan Ave
- 2727 Sheridan Ave
- 2603 27th Place
- 2608 Sheridan Ave