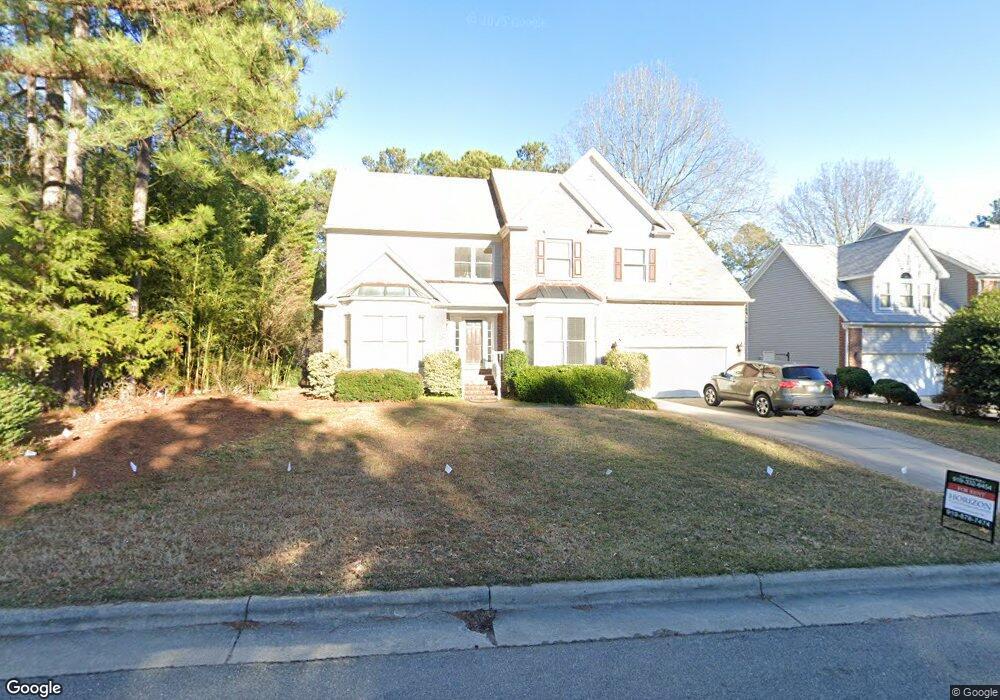
2705 Coxindale Dr Raleigh, NC 27615
Durant NeighborhoodEstimated Value: $583,000 - $671,000
4
Beds
3
Baths
2,720
Sq Ft
$229/Sq Ft
Est. Value
About This Home
This home is located at 2705 Coxindale Dr, Raleigh, NC 27615 and is currently estimated at $623,421, approximately $229 per square foot. 2705 Coxindale Dr is a home located in Wake County with nearby schools including Durant Road Elementary, Durant Road Middle, and Millbrook High School.
Ownership History
Date
Name
Owned For
Owner Type
Purchase Details
Closed on
Aug 24, 2020
Sold by
Arkemia Properties Llc
Bought by
Bowers Eric and Bowers Rungpiroon
Current Estimated Value
Home Financials for this Owner
Home Financials are based on the most recent Mortgage that was taken out on this home.
Original Mortgage
$370,000
Outstanding Balance
$328,429
Interest Rate
3.62%
Mortgage Type
New Conventional
Estimated Equity
$294,992
Purchase Details
Closed on
Jan 13, 2012
Sold by
The Bank Of New York Mellon Trust Compan
Bought by
Ghodrat Hushang and Akrami Mahsa
Purchase Details
Closed on
Jun 4, 1999
Sold by
Meli Andrea Phyllis and Teske Andrea Meli
Bought by
Ahmad Issam and Ahmad Alia
Home Financials for this Owner
Home Financials are based on the most recent Mortgage that was taken out on this home.
Original Mortgage
$193,200
Interest Rate
10.87%
Purchase Details
Closed on
Jan 20, 1998
Sold by
Teske Edward B
Bought by
Meli Andrea Phyllis
Create a Home Valuation Report for This Property
The Home Valuation Report is an in-depth analysis detailing your home's value as well as a comparison with similar homes in the area
Home Values in the Area
Average Home Value in this Area
Purchase History
| Date | Buyer | Sale Price | Title Company |
|---|---|---|---|
| Bowers Eric | $370,000 | None Available | |
| Ghodrat Hushang | $230,000 | Chicago Title Insurance Co | |
| Ahmad Issam | $258,000 | -- | |
| Meli Andrea Phyllis | -- | -- |
Source: Public Records
Mortgage History
| Date | Status | Borrower | Loan Amount |
|---|---|---|---|
| Open | Bowers Eric | $370,000 | |
| Previous Owner | Ahmad Issam | $193,200 |
Source: Public Records
Tax History
| Year | Tax Paid | Tax Assessment Tax Assessment Total Assessment is a certain percentage of the fair market value that is determined by local assessors to be the total taxable value of land and additions on the property. | Land | Improvement |
|---|---|---|---|---|
| 2025 | $5,005 | $571,652 | $210,000 | $361,652 |
| 2024 | $4,985 | $571,652 | $210,000 | $361,652 |
| 2023 | $4,575 | $417,914 | $108,000 | $309,914 |
| 2022 | $4,251 | $417,914 | $108,000 | $309,914 |
| 2021 | $4,086 | $417,914 | $108,000 | $309,914 |
| 2020 | $4,012 | $417,914 | $108,000 | $309,914 |
| 2019 | $3,917 | $336,305 | $98,550 | $237,755 |
| 2018 | $0 | $336,305 | $98,550 | $237,755 |
| 2017 | $3,519 | $336,305 | $98,550 | $237,755 |
| 2016 | $3,446 | $336,305 | $98,550 | $237,755 |
| 2015 | $3,407 | $327,065 | $91,800 | $235,265 |
| 2014 | -- | $327,065 | $91,800 | $235,265 |
Source: Public Records
Map
Nearby Homes
- 2804 Shofield Ct
- 2505 Coxindale Dr
- 8612 Clovehitch Ct
- 2501 Scouting Trail
- 2224 Effingham Cir
- 3047 Coxindale Dr
- 8324 Bellingham Cir
- 3109 Benton Cir
- 2605 Deanwood Dr
- 8808 Colesbury Dr
- 8209 Bellingham Cir
- 2408 Lemuel Dr
- 8309 Harps Mill Rd
- 2420 Clerestory Place
- 9209 Dakins Ct
- 2216 Gresham Lake Rd
- 2628 Crofton Springs Dr
- 7707 Litcham Dr
- 7417 New Hampshire Ct
- 9112 W Doublebit Dr
- 2709 Coxindale Dr
- 2600 Trickle Ct
- 2604 Trickle Ct
- 2713 Coxindale Dr
- 2700 Coxindale Dr
- 2704 Coxindale Dr
- 2608 Trickle Ct
- 2708 Coxindale Dr
- 2624 Coxindale Dr
- 2801 Coxindale Dr
- 3104 Canoe Ct
- 8625 Wheeling Dr
- 2601 Trickle Ct
- 2609 Trickle Ct
- 2709 Iman Dr
- 8621 Wheeling Dr
- 8508 Babble Ln
- 2805 Coxindale Dr
- 2605 Trickle Ct
- 2712 Iman Dr
Your Personal Tour Guide
Ask me questions while you tour the home.