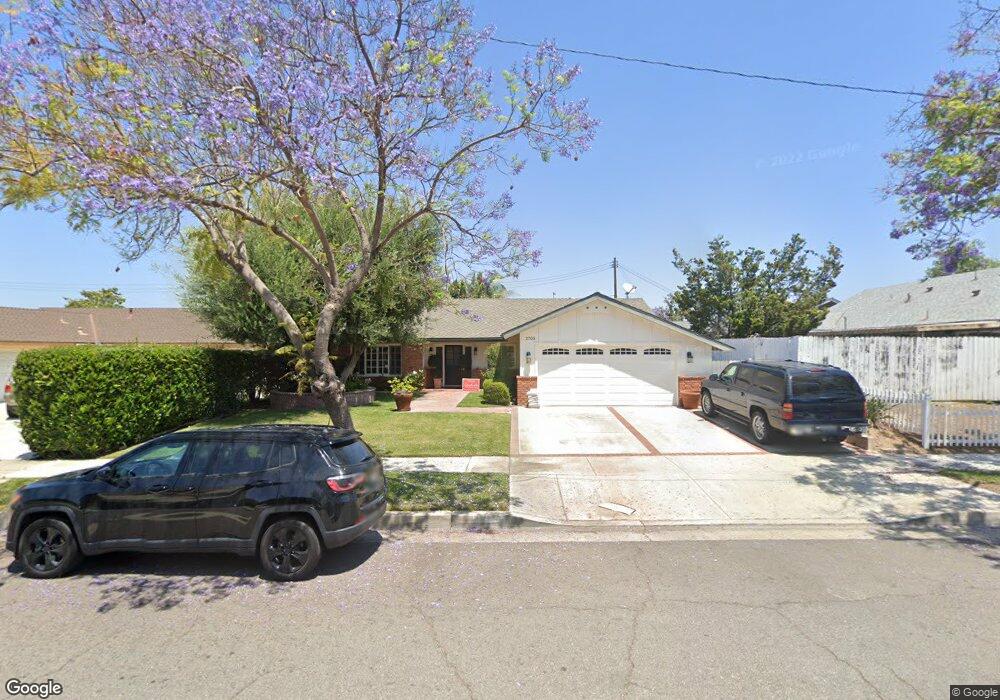
2705 E Jacaranda Ave Orange, CA 92867
Estimated Value: $1,126,000 - $1,265,000
4
Beds
2
Baths
2,044
Sq Ft
$572/Sq Ft
Est. Value
About This Home
This home is located at 2705 E Jacaranda Ave, Orange, CA 92867 and is currently estimated at $1,170,056, approximately $572 per square foot. 2705 E Jacaranda Ave is a home located in Orange County with nearby schools including Handy Elementary School, Cerro Villa Middle School, and Villa Park High School.
Ownership History
Date
Name
Owned For
Owner Type
Purchase Details
Closed on
Oct 21, 2002
Sold by
Shaffer Luke and Shaffer Nina
Bought by
Labrie Alex K and Labrie Tiffany B
Current Estimated Value
Home Financials for this Owner
Home Financials are based on the most recent Mortgage that was taken out on this home.
Original Mortgage
$336,000
Outstanding Balance
$139,113
Interest Rate
5.99%
Estimated Equity
$1,030,943
Purchase Details
Closed on
Dec 19, 1997
Sold by
Nancy Parker
Bought by
Shaffer Luke and Shaffer Nina
Home Financials for this Owner
Home Financials are based on the most recent Mortgage that was taken out on this home.
Original Mortgage
$167,200
Interest Rate
4.95%
Purchase Details
Closed on
Oct 4, 1994
Sold by
Harris Hollis Warren and Harris Carolyn Marie
Bought by
Parker Nancy D
Create a Home Valuation Report for This Property
The Home Valuation Report is an in-depth analysis detailing your home's value as well as a comparison with similar homes in the area
Home Values in the Area
Average Home Value in this Area
Purchase History
| Date | Buyer | Sale Price | Title Company |
|---|---|---|---|
| Labrie Alex K | $420,000 | Fidelity National Title | |
| Shaffer Luke | $209,000 | Orange Coast Title | |
| Parker Nancy D | $195,000 | Orange Coast Title |
Source: Public Records
Mortgage History
| Date | Status | Borrower | Loan Amount |
|---|---|---|---|
| Open | Labrie Alex K | $336,000 | |
| Previous Owner | Shaffer Luke | $167,200 | |
| Closed | Labrie Alex K | $63,000 |
Source: Public Records
Tax History
| Year | Tax Paid | Tax Assessment Tax Assessment Total Assessment is a certain percentage of the fair market value that is determined by local assessors to be the total taxable value of land and additions on the property. | Land | Improvement |
|---|---|---|---|---|
| 2025 | $6,698 | $608,292 | $463,859 | $144,433 |
| 2024 | $6,698 | $596,365 | $454,764 | $141,601 |
| 2023 | $6,550 | $584,672 | $445,847 | $138,825 |
| 2022 | $6,423 | $573,208 | $437,105 | $136,103 |
| 2021 | $6,244 | $561,969 | $428,534 | $133,435 |
| 2020 | $6,187 | $556,207 | $424,140 | $132,067 |
| 2019 | $6,109 | $545,301 | $415,823 | $129,478 |
| 2018 | $6,017 | $534,609 | $407,669 | $126,940 |
| 2017 | $5,767 | $524,127 | $399,676 | $124,451 |
| 2016 | $5,656 | $513,850 | $391,839 | $122,011 |
| 2015 | $5,574 | $506,132 | $385,953 | $120,179 |
| 2014 | $5,455 | $496,218 | $378,393 | $117,825 |
Source: Public Records
Map
Nearby Homes
- 773 N Elmwood St
- 2710 E Adams Ave
- 1163 N Hart St
- 1166 N Handy St
- 2331 E Adams Ave
- 2929 E Hamilton Ave
- 692 N Adele St Unit 50
- 692 N Adele St Unit 30
- 692 N Adele St Unit 78
- 2705 E Orange Grove Ave
- 1920 E Barkley Ave
- 18062 Rosanne Cir
- 1801 E Collins Ave Unit 36
- 605 N Pageant Dr Unit B
- 2720 E Walnut Ave Unit 73
- 3106 E Trenton Ave
- 3527 E Barrington Dr
- 10762 Center Dr
- 1420 N Sacramento St
- 478 N Swidler St
- 2701 E Jacaranda Ave
- 952 N Hart St
- 962 N Hart St
- 2706 E Locust Ave
- 2641 E Jacaranda Ave
- 2644 E Locust Ave
- 970 N Hart St
- 2712 E Jacaranda Ave
- 2640 E Locust Ave
- 930 N Hart St
- 2702 E Jacaranda Ave
- 2631 E Jacaranda Ave
- 2642 E Jacaranda Ave
- 2630 E Locust Ave
- 920 N Hart St
- 2621 E Jacaranda Ave
- 947 N Hart St
- 957 N Hart St
- 2632 E Jacaranda Ave
- 937 N Hart St
Your Personal Tour Guide
Ask me questions while you tour the home.