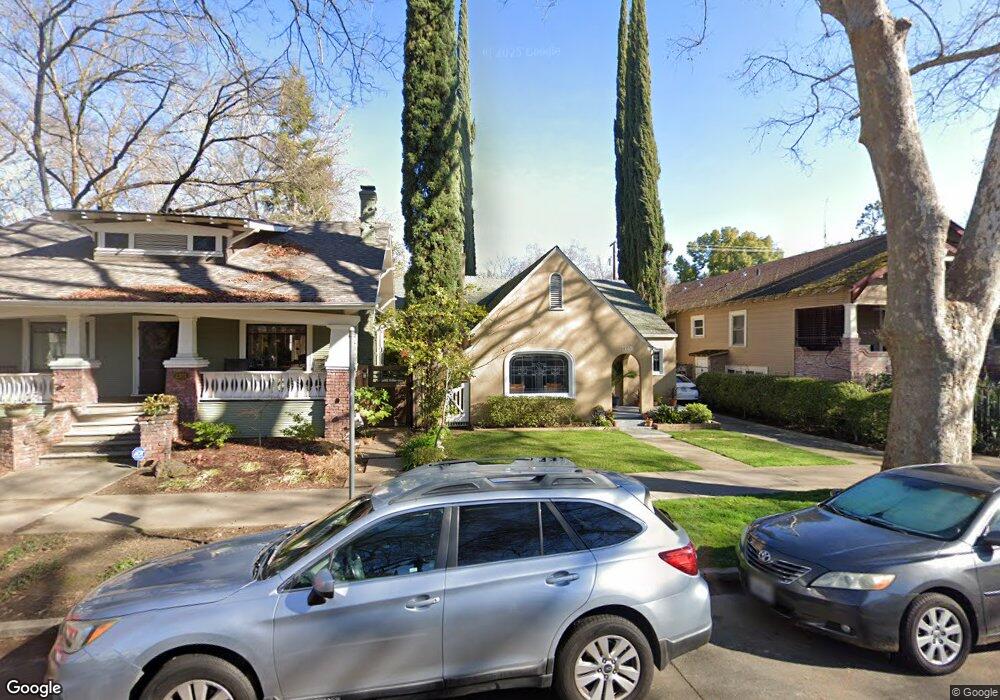
2705 E St Sacramento, CA 95816
New Era Park NeighborhoodEstimated Value: $464,000 - $607,000
2
Beds
1
Bath
956
Sq Ft
$570/Sq Ft
Est. Value
About This Home
This home is located at 2705 E St, Sacramento, CA 95816 and is currently estimated at $544,901, approximately $569 per square foot. 2705 E St is a home located in Sacramento County with nearby schools including Washington Elementary, Miwok Middle School, and C. K. McClatchy High.
Ownership History
Date
Name
Owned For
Owner Type
Purchase Details
Closed on
Aug 11, 2011
Sold by
Castillo Christopher and Wheeler Jesse W
Bought by
Castillo Christopher and Wheeler Jesse W
Current Estimated Value
Home Financials for this Owner
Home Financials are based on the most recent Mortgage that was taken out on this home.
Original Mortgage
$146,000
Outstanding Balance
$100,569
Interest Rate
4.46%
Mortgage Type
New Conventional
Estimated Equity
$444,332
Purchase Details
Closed on
Dec 17, 2001
Sold by
Hardy Terri J
Bought by
Castillo Christopher and Wheeler Jesse W
Home Financials for this Owner
Home Financials are based on the most recent Mortgage that was taken out on this home.
Original Mortgage
$184,000
Interest Rate
6.39%
Purchase Details
Closed on
Dec 14, 1998
Sold by
Skarstad John L
Bought by
Hardy Terri J
Home Financials for this Owner
Home Financials are based on the most recent Mortgage that was taken out on this home.
Original Mortgage
$131,123
Interest Rate
6.86%
Mortgage Type
FHA
Create a Home Valuation Report for This Property
The Home Valuation Report is an in-depth analysis detailing your home's value as well as a comparison with similar homes in the area
Home Values in the Area
Average Home Value in this Area
Purchase History
| Date | Buyer | Sale Price | Title Company |
|---|---|---|---|
| Castillo Christopher | -- | Placer Title Company | |
| Castillo Christopher | $230,000 | Stewart Title | |
| Hardy Terri J | $132,000 | Chicago Title Co |
Source: Public Records
Mortgage History
| Date | Status | Borrower | Loan Amount |
|---|---|---|---|
| Open | Castillo Christopher | $146,000 | |
| Previous Owner | Castillo Christopher | $184,000 | |
| Previous Owner | Hardy Terri J | $131,123 |
Source: Public Records
Tax History
| Year | Tax Paid | Tax Assessment Tax Assessment Total Assessment is a certain percentage of the fair market value that is determined by local assessors to be the total taxable value of land and additions on the property. | Land | Improvement |
|---|---|---|---|---|
| 2025 | $4,014 | $339,756 | $84,193 | $255,563 |
| 2024 | $4,014 | $333,095 | $82,543 | $250,552 |
| 2023 | $3,918 | $326,565 | $80,925 | $245,640 |
| 2022 | $3,850 | $320,163 | $79,339 | $240,824 |
| 2021 | $3,669 | $313,886 | $77,784 | $236,102 |
| 2020 | $3,696 | $310,669 | $76,987 | $233,682 |
| 2019 | $3,583 | $304,578 | $75,478 | $229,100 |
| 2018 | $3,568 | $298,607 | $73,999 | $224,608 |
| 2017 | $3,519 | $292,753 | $72,549 | $220,204 |
| 2016 | $3,453 | $287,014 | $71,127 | $215,887 |
| 2015 | $3,404 | $282,704 | $70,059 | $212,645 |
| 2014 | $3,313 | $277,167 | $68,687 | $208,480 |
Source: Public Records
Map
Nearby Homes
Your Personal Tour Guide
Ask me questions while you tour the home.