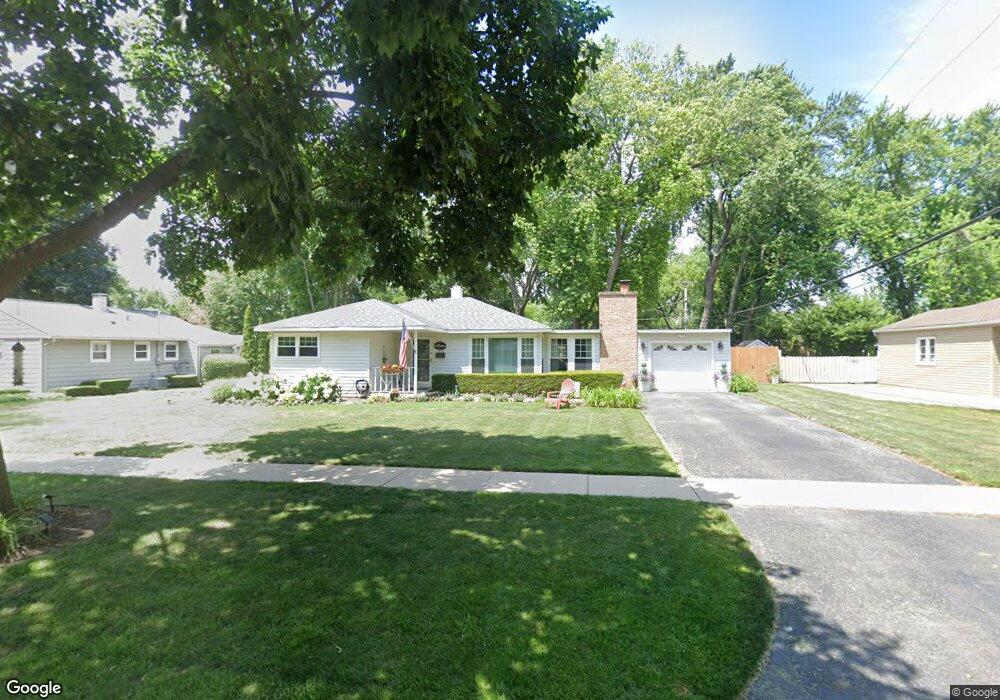
2705 Oriole Ln Rolling Meadows, IL 60008
Estimated Value: $326,000 - $355,000
3
Beds
1
Bath
1,296
Sq Ft
$263/Sq Ft
Est. Value
About This Home
This home is located at 2705 Oriole Ln, Rolling Meadows, IL 60008 and is currently estimated at $341,380, approximately $263 per square foot. 2705 Oriole Ln is a home located in Cook County with nearby schools including Kimball Hill Elementary School, King Elementary School, and Carl Sandburg Junior High School.
Ownership History
Date
Name
Owned For
Owner Type
Purchase Details
Closed on
Sep 29, 1999
Sold by
Kundrot Jack and Kundrot Kristin J
Bought by
Pedraza David and Slove Pedraza Kimberly M
Current Estimated Value
Home Financials for this Owner
Home Financials are based on the most recent Mortgage that was taken out on this home.
Original Mortgage
$152,352
Outstanding Balance
$46,001
Interest Rate
7.83%
Mortgage Type
FHA
Estimated Equity
$295,379
Purchase Details
Closed on
Dec 1, 1993
Sold by
Pittman Robert E and Pittman Carol D
Bought by
Kundrot Jack and Kundrot Kristin J
Home Financials for this Owner
Home Financials are based on the most recent Mortgage that was taken out on this home.
Original Mortgage
$116,800
Interest Rate
7.25%
Create a Home Valuation Report for This Property
The Home Valuation Report is an in-depth analysis detailing your home's value as well as a comparison with similar homes in the area
Home Values in the Area
Average Home Value in this Area
Purchase History
| Date | Buyer | Sale Price | Title Company |
|---|---|---|---|
| Pedraza David | $157,000 | -- | |
| Kundrot Jack | $86,666 | -- |
Source: Public Records
Mortgage History
| Date | Status | Borrower | Loan Amount |
|---|---|---|---|
| Open | Pedraza David | $152,352 | |
| Previous Owner | Kundrot Jack | $116,800 |
Source: Public Records
Tax History Compared to Growth
Tax History
| Year | Tax Paid | Tax Assessment Tax Assessment Total Assessment is a certain percentage of the fair market value that is determined by local assessors to be the total taxable value of land and additions on the property. | Land | Improvement |
|---|---|---|---|---|
| 2024 | $6,952 | $26,000 | $6,042 | $19,958 |
| 2023 | $6,627 | $26,000 | $6,042 | $19,958 |
| 2022 | $6,627 | $26,000 | $6,042 | $19,958 |
| 2021 | $5,461 | $19,819 | $3,570 | $16,249 |
| 2020 | $5,406 | $19,819 | $3,570 | $16,249 |
| 2019 | $5,445 | $22,145 | $3,570 | $18,575 |
| 2018 | $5,911 | $21,685 | $3,295 | $18,390 |
| 2017 | $5,810 | $21,685 | $3,295 | $18,390 |
| 2016 | $5,672 | $21,685 | $3,295 | $18,390 |
| 2015 | $4,863 | $18,067 | $3,020 | $15,047 |
| 2014 | $4,763 | $18,067 | $3,020 | $15,047 |
| 2013 | $4,631 | $18,067 | $3,020 | $15,047 |
Source: Public Records
Map
Nearby Homes
- 2611 South St
- 1615 W Johanna Terrace
- 3208 Wren Ln
- 2201 Kingfisher Ln
- 3316 Trillium Cir
- 2100 Martin Ln
- 502 S Reuter Dr
- 3125 Town Square Dr Unit 408
- 12 S Princeton Ct
- 617 N Wilke Rd
- 3265 Kirchoff Rd Unit 223
- 3275 Kirchoff Rd Unit 337
- 3400 Wellington Ct Unit 306
- 222 S Dwyer Ave
- 3355 Kirchoff Rd Unit 6A
- 3805 Wren Ln
- 3600 Owl Dr
- 2401 Rohlwing Rd
- 1506 W Northwest Hwy
- 3805 Fairfax Ave
- 2703 Oriole Ln
- 2400 George St
- 2402 George St
- 2403 Sigwalt St
- 2401 Sigwalt St
- 2404 George St
- 2704 Oriole Ln
- 2405 Sigwalt St
- 2702 Oriole Ln
- 2310 George St
- 2406 George St
- 2401 George St
- 2311 Sigwalt St
- 2407 Sigwalt St
- 2308 George St
- 2408 George St
- 2403 George St
- 2309 Sigwalt St
- 2311 George St
- 2405 George St