Estimated Value: $213,000 - $262,788
Studio
1
Bath
1,085
Sq Ft
$221/Sq Ft
Est. Value
About This Home
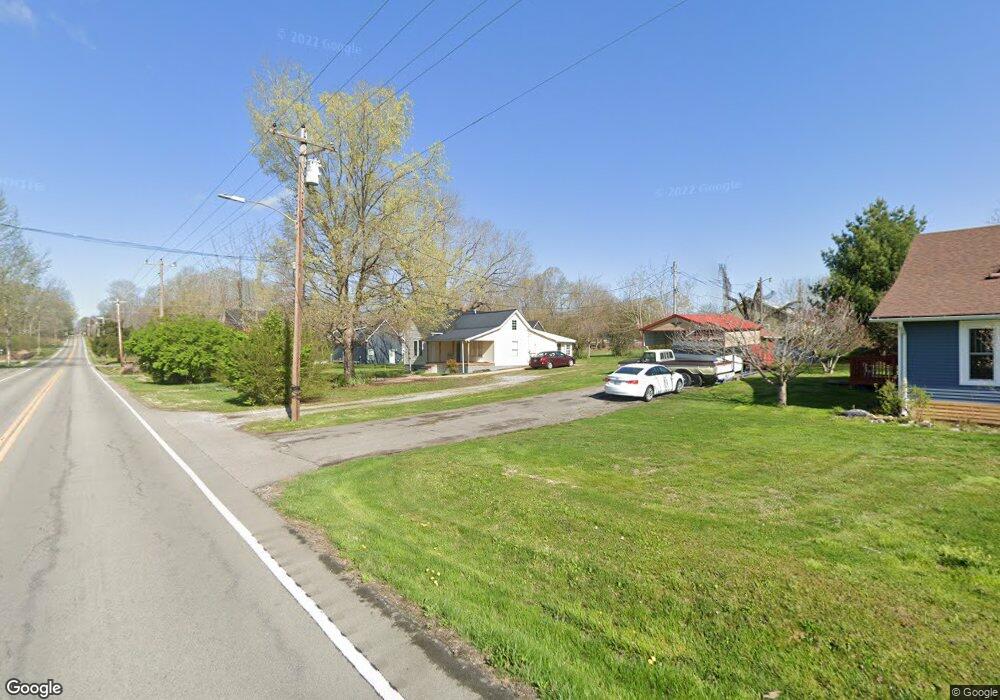
This home is located at 2705 Stuart St, Burns, TN 37029 and is currently estimated at $239,447, approximately $220 per square foot. 2705 Stuart St is a home located in Dickson County with nearby schools including Stuart Burns Elementary School, Burns Middle School, and Dickson County High School.
Ownership History
Date
Name
Owned For
Owner Type
Purchase Details
Closed on
May 13, 2021
Sold by
Ford Haydn Alexandra
Bought by
Carlson Kyle and Mcclendon Kylie
Current Estimated Value
Home Financials for this Owner
Home Financials are based on the most recent Mortgage that was taken out on this home.
Original Mortgage
$154,500
Outstanding Balance
$139,718
Interest Rate
3.1%
Mortgage Type
New Conventional
Estimated Equity
$99,729
Purchase Details
Closed on
Sep 14, 2020
Sold by
Ford Haydn Alexandra
Bought by
Jdf Properties Llc
Purchase Details
Closed on
Mar 10, 2020
Sold by
United States Of America
Bought by
Ford Haydn Alexandra
Home Financials for this Owner
Home Financials are based on the most recent Mortgage that was taken out on this home.
Original Mortgage
$123,200
Interest Rate
3.4%
Mortgage Type
Commercial
Purchase Details
Closed on
Apr 29, 2008
Sold by
Garton Jack L
Bought by
Jtg Family Llc
Purchase Details
Closed on
Apr 15, 2008
Sold by
Holder Timothy K
Bought by
Garton Jack L
Purchase Details
Closed on
Jun 13, 1967
Bought by
Brown Zena S
Create a Home Valuation Report for This Property
The Home Valuation Report is an in-depth analysis detailing your home's value as well as a comparison with similar homes in the area
Home Values in the Area
Average Home Value in this Area
Purchase History
| Date | Buyer | Sale Price | Title Company |
|---|---|---|---|
| Carlson Kyle | $155,000 | Bankers T&E Dickson Llc | |
| Jdf Properties Llc | -- | Bankers T&E Dickson Llc | |
| Ford Haydn Alexandra | $154,000 | Crown Title Corporation | |
| Jtg Family Llc | -- | -- | |
| Garton Jack L | $42,000 | -- | |
| Brown Zena S | -- | -- |
Source: Public Records
Mortgage History
| Date | Status | Borrower | Loan Amount |
|---|---|---|---|
| Open | Carlson Kyle | $154,500 | |
| Previous Owner | Ford Haydn Alexandra | $123,200 |
Source: Public Records
Tax History
| Year | Tax Paid | Tax Assessment Tax Assessment Total Assessment is a certain percentage of the fair market value that is determined by local assessors to be the total taxable value of land and additions on the property. | Land | Improvement |
|---|---|---|---|---|
| 2025 | -- | $41,450 | $12,500 | $28,950 |
| 2024 | -- | $41,450 | $12,500 | $28,950 |
| 2023 | $773 | $28,100 | $6,825 | $21,275 |
| 2022 | $773 | $28,100 | $6,825 | $21,275 |
| 2021 | $773 | $28,100 | $6,825 | $21,275 |
| 2020 | $0 | $28,100 | $6,825 | $21,275 |
| 2019 | $791 | $28,775 | $7,500 | $21,275 |
| 2018 | $641 | $19,625 | $7,500 | $12,125 |
| 2017 | $641 | $19,625 | $7,500 | $12,125 |
| 2016 | $641 | $19,625 | $7,500 | $12,125 |
| 2015 | $623 | $17,650 | $7,500 | $10,150 |
| 2014 | $623 | $17,650 | $7,500 | $10,150 |
Source: Public Records
Map
Nearby Homes
- 112 Holland St
- 1027 Mulberry St
- 3215 Church St
- 206 College St
- 1014 Village Ct
- 594 Main St
- 1156 Chestnut Dr
- 1152 Chestnut Dr
- 1151 Chestnut Dr
- 0 Rambaugh Unit RTC3098637
- 1021 Preston Dr
- 106 Florence Cove
- 2305 Highway 47 E
- 112 Florence Cove
- 107 Florence Cove
- 108 Florence Cove
- 105 Florence Cove
- 118 Florence Cove
- 555 Buddy Rd
- 2237 Highway 47 E
- 2705 Tennessee 47
- 504 Old Highway 47 E
- 512 Main St
- 504 Main St
- 508 Main St
- 2707 Stuart St
- 2706 Stuart St
- 2702 Stuart St
- 604 Main St
- 2713 Stuart St
- 598 Main St
- 513 Main St
- 0 Main St Unit 1597399
- 0 Main St Unit 1646514
- 2715 Stuart St
- 108 Spencer St
- 995 Railroad St
- 1001 Holland St
- 608 Main St
- 107 Holland St
Your Personal Tour Guide
Ask me questions while you tour the home.